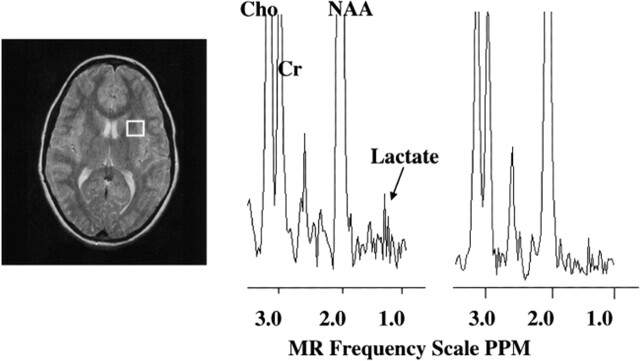
fig 2.
MR image and proton spectra from an activated brain region of one dyslexic participant. The spectroscopic data were collected using 4000/272 proton echo-planar spectroscopic imaging. The MR image was collected using a 2000/80 fast spin-echo pulse sequence. The intensity axis of the spectra is scaled so that the lactate can be visualized more easily; however, choline and NAA are scaled off the figure. Note the decrease in the lactate peaks for the posttreatment spectrum. Cho, choline; CR, creatine. A, MR image with white box indicating the brain region measured with MR spectroscopy. B, Proton MR spectrum from the white box brain region before treatment (the lactate resonance has a signal-to-noise ratio of 2.2). C, Proton MR spectrum from the white box brain region after treatment (lactate has a signal-to-noise ratio of 1.6).

