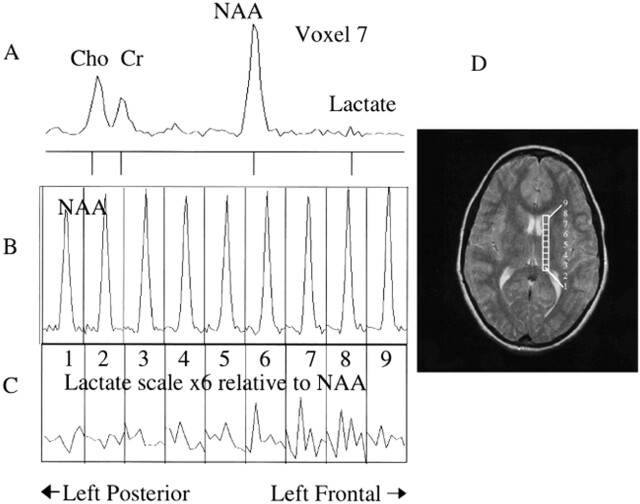
fig 3.
Proton MR spectra and image from a dyslexic boy before treatment during the phonologic task. A, Spectrum from voxel 7 shows choline (CHO), creatine (Cr), NAA, and lactate. B, Nine spectra from nine adjacent voxels (position is shown in D), zoomed into the NAA region (1.7−2.3 ppm). C, Nine spectra from nine adjacent voxels, zoomed into the lactate region (1.10−1.33 ppm). The vertical scale of this set was increased six times higher than the NAA set so that lactate could be easily visualized. An increase in lactate can be clearly seen in voxels 6 through 8 compared with voxels 1 through 4. D, MR image shows the location of the nine voxels shown in A through C.

