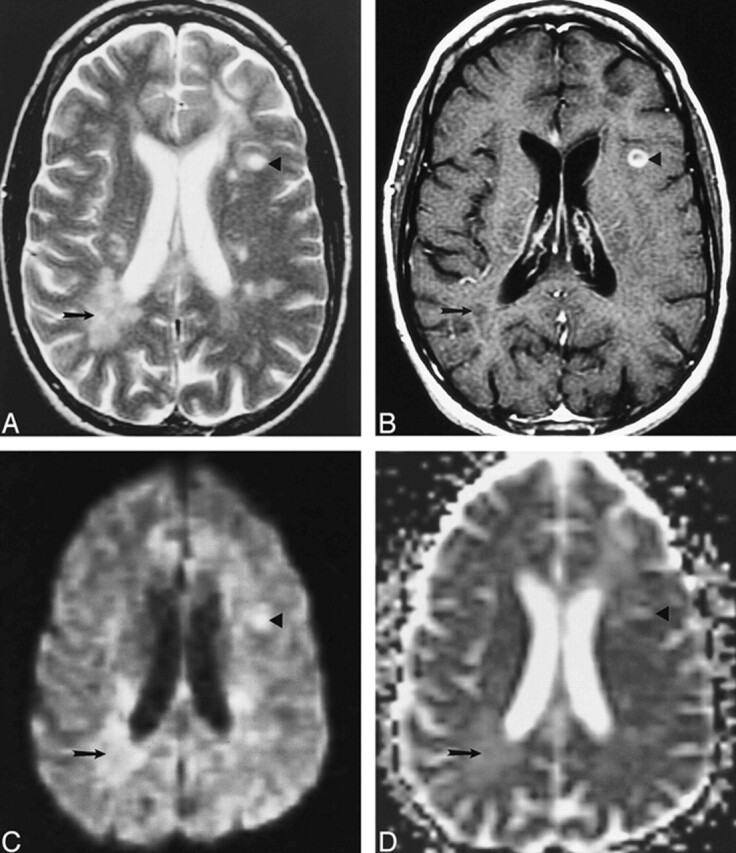
fig 1.

Examples of an NEL and an REL in a patient with MS.
A–D, Axial T2-weighted image (4000/110/1) (A), contrast-enhanced T1-weighted image (500/20/1) (B), isotropic diffusion-weighted image (4000/125/1) (C), and trace ADC map (D) show a T1-weighted NEL (arrow) and a T1-weighted REL (arrowhead). Both lesions show increased diffusion on the trace ADC map.
