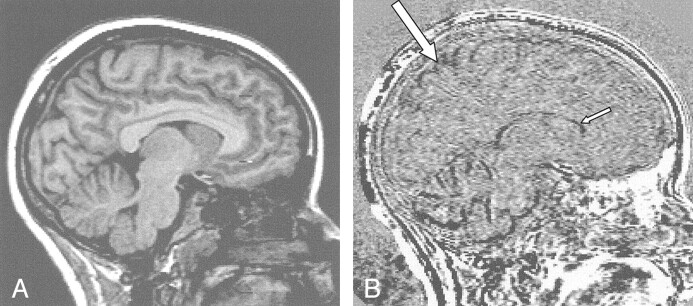
Fig 1.
Brain and ventricular changes before and after treatment in a patient with hyperthyroidism.
A, Sagittal T1-weighted image near the midline of the brain.
B, Registered subtraction image. The low-signal-intensity boundaries at the cortex (large arrow) indicate reduced brain size, and the low-signal-intensity seen more centrally (small arrow) indicates ventricular enlargement.

