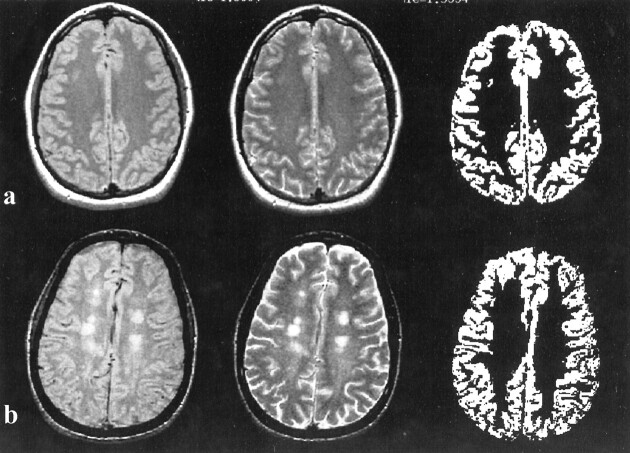
fig 1.
Segmentation of gray matter results (right) and corresponding proton density– (left) and T2-weighted (middle) in control subjects (A) and patients (B). Note that the enlargement of the sulci attributable to brain atrophy could be seen on the T2-weighted image (B, middle) in MS patients, which might be due to the volume loss of white matter

