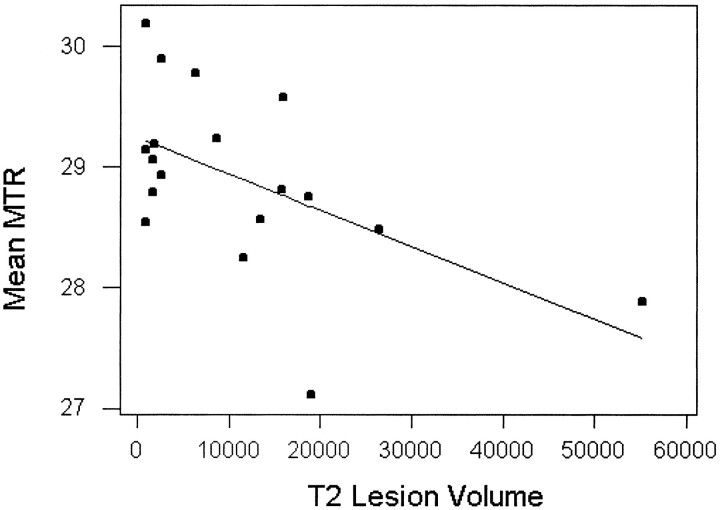
fig 4.
Regression analysis of gray matter MTR mean values versus total T2 lesion volume (mm3) in relapsing-remitting MS patients. Dots are the mean MTR values for individual patients. The line represents the predictive mean MTR with total T2 lesion volume as a function. There was an inverse correlation (Pearson correlation coefficient, r = −0.55) between mean MTR of gray matter and T2 lesion volume

