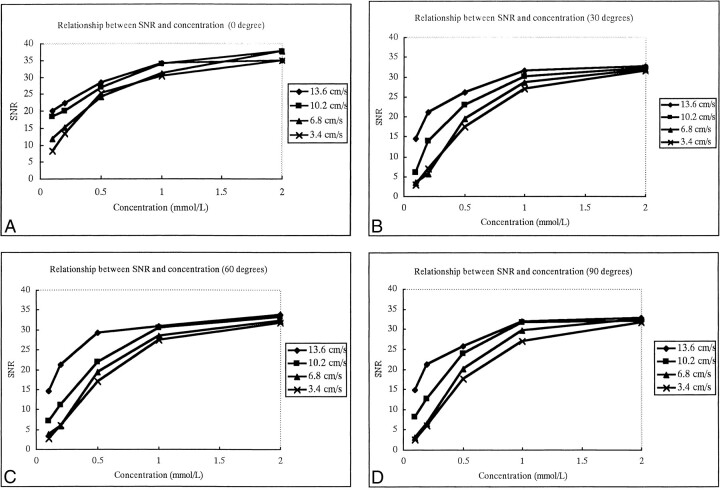
fig 2.
A–D, The relationship between SNR of flow and concentration of contrast material using four different scan angles between the plastic tube and the slab: 0° (A), 30° (B), 60° (C), and 90° (D). The four curves within one graph represent four different flow velocities. SNR increases as the contrast material concentration increases, but less dramatically after 1 mmol/L concentration

