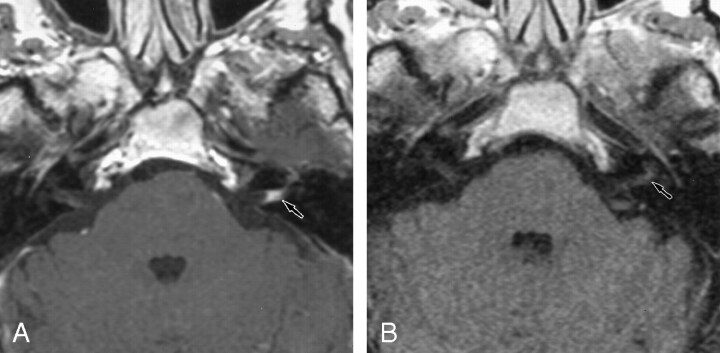
Fig 3.
Axial contrast-enhanced T1-weight-ed MR images show meningeal enhancement in the IAC.
A, The 1.5-T image (550/20/3) obtained at the level of the IAC shows contrast enhancement in the left IAC, with concave limits corresponding to a meningeal enhancement (arrow).
B, The 0.2-T image (650/15/3) shows no contrast enhancement in the left IAC (arrow).

