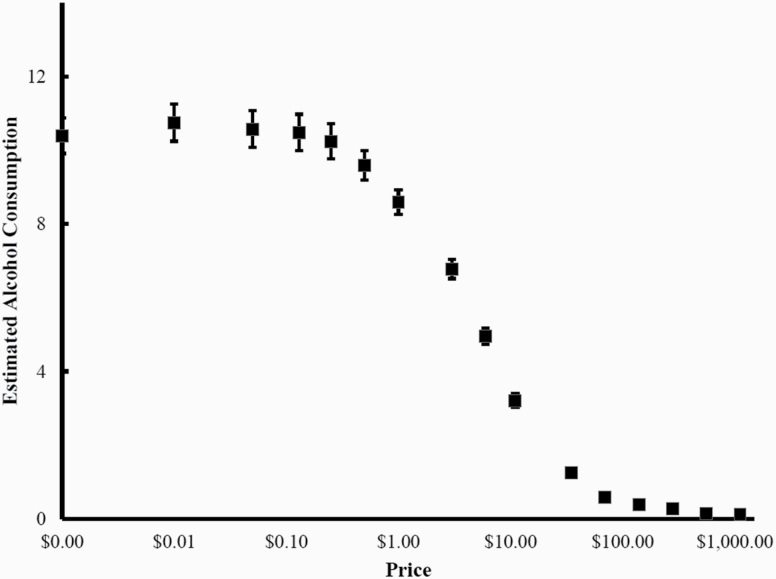
Figure 1.
Demand curve for number of drinks purchased on the Alcohol Purchase Task (APT). Log coordinates for price on the horizontal axis are used for proportionality. Intensity is depicted as value of .001 instead of zero due to log axis. Only participants with complete and valid data are included.

