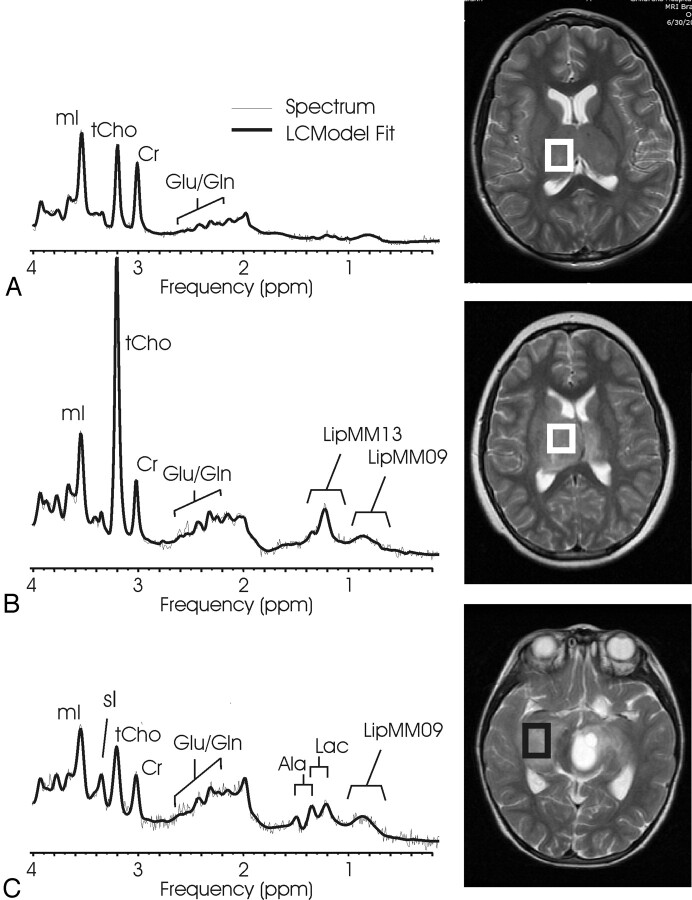
Fig 4.
Low-grade astrocytoma and anaplastic astrocytoma. Short echo time (TE) MR spectra of 2 anaplastic astrocytomas (A, -B) and of low-grade astrocytoma (C) with corresponding MR images indicating the regions of interest are shown. The 3 spectra are scaled according to measured concentrations to allow direct comparison. Astrocytomas appear to be quite heterogeneous. Note the striking difference in total choline (tCho) in spectra A and B, tumors of the same diagnostic name. The prominent scyllo-inositol (sI) observed in spectrum C is not representative for all astrocytoma.

