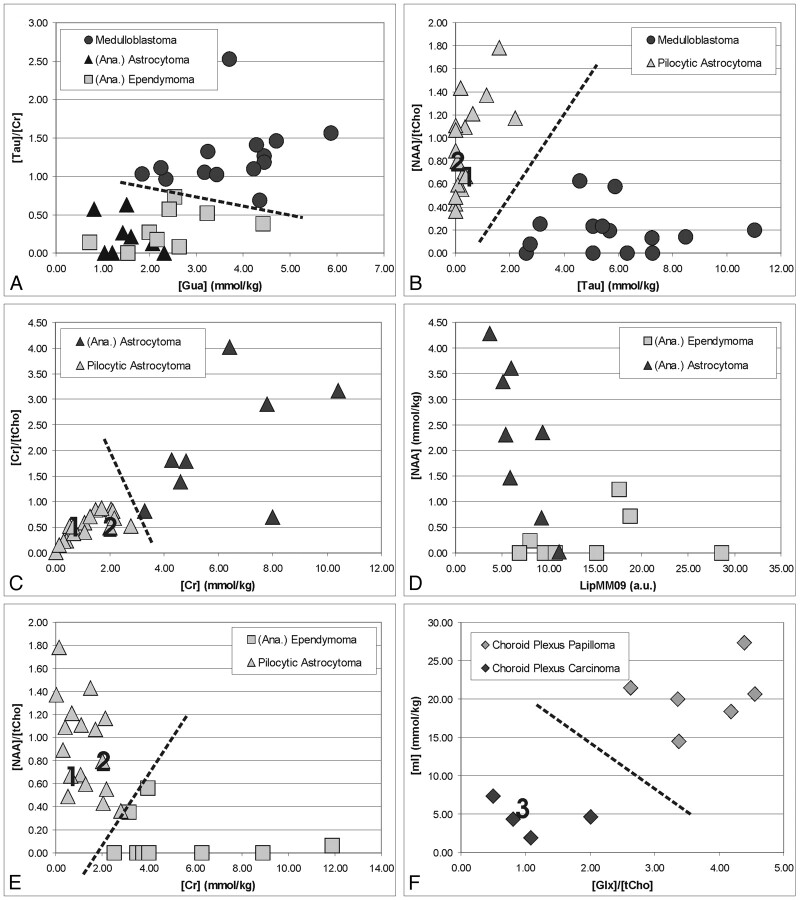
Fig 7.
Differentiation of common pediatric brain tumors by quantitative 1H-MR spectroscopy. Shown are measured concentrations and concentration ratios of tumors obtained from individual spectra. Labels 1, 2, and 3 in B, C, E, and F indicate data points obtained from individual spectra of the 3 cases presented in more detail in the Results section.

