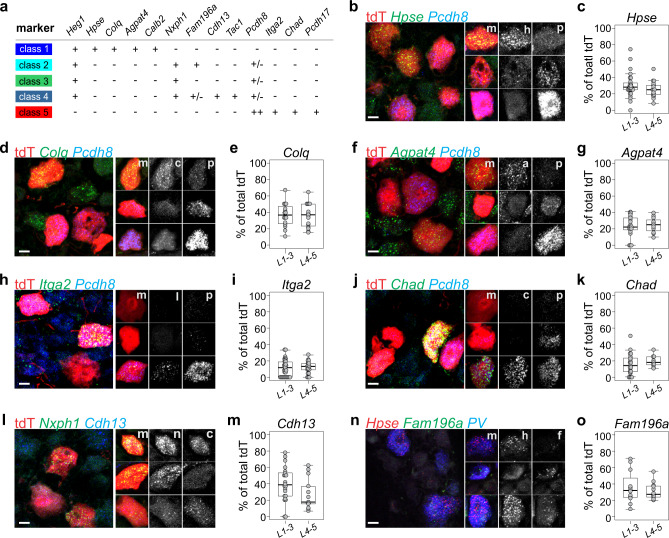
Fig. 3. Validation of molecularly distinct proprioceptor subtypes.
a Summary of transcripts examined in validation assays. Transcript expression levels are indicated by “++” (high expression levels in most neurons), “+” (intermediate expression level in most neurons), “+/−“ (lower expression levels in all or a subset of neurons), or “–“ (no or nearly no expression). b–g Expression of cluster I transcripts Hpse, Colq, and Agpat4 in relation to expression of the cluster 5 transcript Pcdh8 in ≥p56 lumbar DRG of PVRx3:tdT mice. In b, d, f, images of individual neurons represent examples of observed transcript combinations other than those observed in the main image. High levels of Hpse (h) (in b), Colq (c) (in d), or Agpat4 (a) (in f) transcript generally are mutually exclusive with high levels of Pcdh8 (p) transcript (m indicates merged image). Percentage of Hpse+tdT+ neurons (c), Colq+tdT+ neurons (e), or Agpat4+tdT+ neurons (g) (of total tdT+) in ≥p56 rostral (L1-3) or caudal (L4-5) lumbar DRG of PVRx3:tdT animals. Mean percentage ± S.E.M. Hpse (L1-3): 30.1 ± 2.8%, n = 28 sections; Hpse (L4-5): 25.4 ± 2.2%, n = 19 sections; Colq(L1-3): 36.7 ± 3.5%, n = 16 sections; Colq(L4-5): 36.1 ± 3.6%, n = 16 sections; Agpat4(L1-3): 23.2 ± 2.8%, n = 21 sections; Agpat4(L4-5): 24.7 ± 2.8%, n = 11 sections. h–k Expression of the cluster 5 transcripts Itga2, Chad, and Pcdh8 in ≥p56 lumbar DRG of PVRx3:tdT mice. In h, j, images of individual neurons represent examples of observed transcript combinations other than those observed in the main image. High transcript levels of Itga2 (i) (in h) or Chad (c) (in j) generally overlap with high levels of Pcdh8 (p) transcript expression (m indicates merged image). i, k Percentage of Itga2+tdT+ neurons (i) or Chad+tdT+ neurons (j) (of total tdT+) in ≥p56 rostral (L1-3) or caudal (L4-5) lumbar DRG of PVRx3:tdT animals. Mean percentage ± S.E.M. Itga2(L1-3): 11.5 ± 1.7%, n = 34 sections; Itga2(L4-5): 12.4 ± 1.6%, n = 21 sections; Chad(L1-3): 15.9 ± 2.6%, n = 23 sections; Chad(L4-5): 19.5 ± 2.4%, n = 9 sections. l Expression of cluster 2–4 transcript Nxph1 and cluster 4 transcript Cdh13 in ≥p56 PVRx3:tdT DRG. Images of individual neurons represent examples of observed transcript combinations other than those observed in the main image. Single neuron analysis confirms that a subset of Nxph1 (n) neurons co-express Cdh13 (c; m indicates merged image). m Percentage of Cdh13+tdT+ neurons (of total tdT+) in adult PVRx3:tdT DRG. Mean percentage ± S.E.M. Cdh13(L1-3): 39.6 ± 4.5%, n = 22 sections; Cdh13(L4-5): 27.3 ± 5.3%, n = 13 sections. n Expression analysis of Hpse (cluster 1), Fam196a (cluster 2 and 4), and PV in adult wild type DRG indicates the presence of cluster 1 Hspe+Fam196aoff, and cluster 2 or 4 HspeoffFam196a+ PV neurons. Images of individual neurons represent examples of observed transcript combinations other than those observed in the main image. A few cluster 1 neurons coexpress Hspe and Fam196a (see also Fig. 2g). o Percentage of Fam196a+tdT+ neurons (of total tdT+) in adult PVRx3:tdT DRG. Mean percentage ± S.E.M. Fam196a(L1-3): 35.9 ± 5.7%, n = 12 sections; Fam196a(L4-5): 31.4 ± 3.0%, n = 12 sections. Similar data obtained from at least three (b, d, f, h, j, l, n) biological replicates. In boxplots (c, e, g, I, k, m, o), boxes indicate medians and 25th/75th percentiles, and whiskers extend to the furthest point <1.5 standard deviations from the mean. Scale 10 μm.

