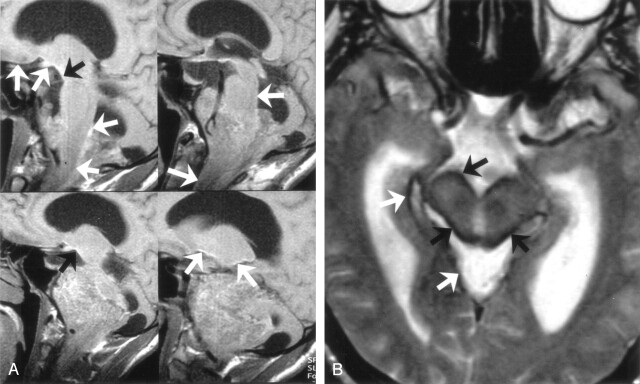
Fig 2.
Four sequential T1-weighted nonenhanced sagittal MR images (A) show linear high signal intensity on the pial surfaces of the cerebrum, cerebellum, brain stem, and spinal cord secondary to pial melanin accumulation (arrows). T2-weighted axial MR image (B) shows striking signal intensity voids on the pial surfaces of brain stem (arrows).

