
Fig 5.
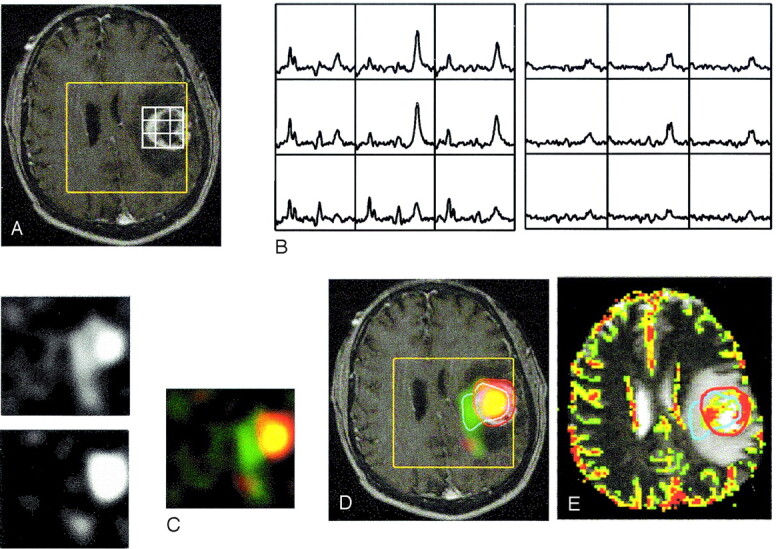
Images in a 49-year-old man with grade IV glioma in the left frontal lobe. Presurgical data show increased mean and maximal rCBV within regions having elevated Lac but no Lip and within regions having elevated Lip but no Lac: contrast-enhanced T1-weighted images with PRESS box (yellow) and part of the voxel grid (white) (A); spectra showing the summed spectra for Cho, Cr, NAA, and elevated Lip (left) and difference spectra showing elevated Lac (right) (B); resampled metabolic images show Lac (upper left), Lip (lower left), and the color overlays (right) for elevated Lac only (green), Lip only (red), and both (yellow) (C); Lac and Lip overlaid on T1-weighted images (D); and rCBV overlaid on T2-weighted images with contours for significantly elevated Lac (blue) and Lip (red) (E).