
Fig 6.
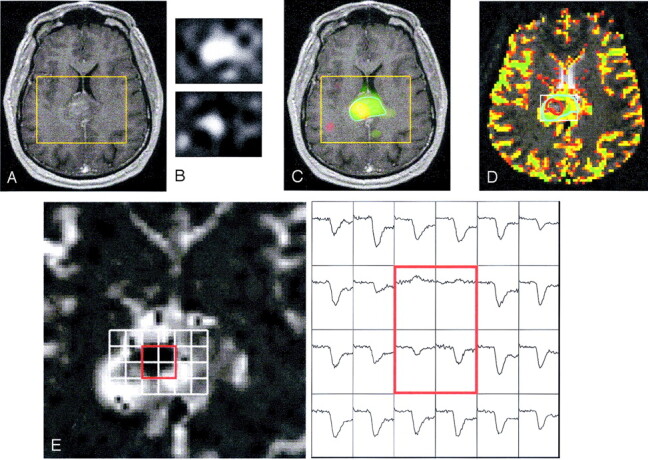
Images in a 45-year-old man with enhancing grade III glioma involving the splenium of the corpus callosum. Presurgical data show elevated Lip in the center of the region with elevated Lac: T1-weighted image showing contrast enhancement but no macronecrosis (A); resampled Lac (upper) and Lip (lower) images (B); Lac (green), Lip (red), and both (yellow) overlaid on a T1-weighted image (C); rCBV overlaid on a T2-weighted image with contours for elevated Lac (blue) and Lip (red) (D); and rCBV curves for voxels in the contrast enhancement (E). Dynamic signal intensity curves for voxels (red square) suggest necrosis, which is consistent with elevated Lip peaks.