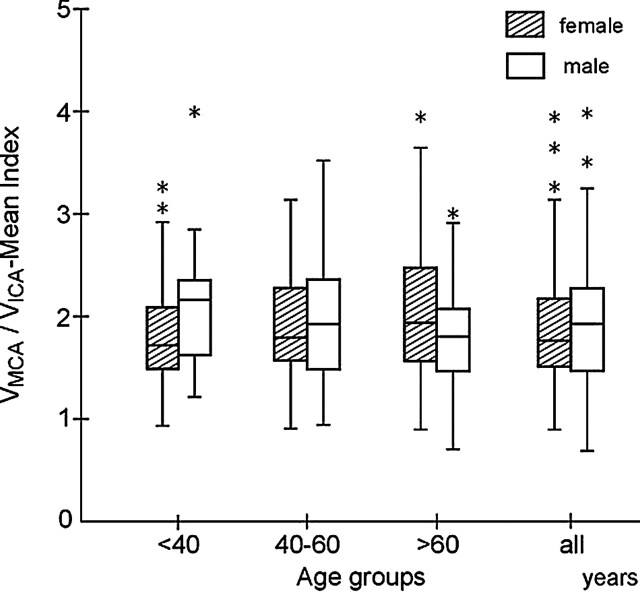
Fig 1.
Distribution of values of the VMCA/VICA index, calculated from the mean MCA and ipsilateral extracranial ICA velocities in women and men in three age groups (<40, 40–60, and >60 years) and in 304 healthy subjects. In women, median value of the index increases with age to 60 years, whereas in men, it is relatively stable. The minimum and maximum values of the variable are indicated by the whiskers (solid lines) of each diagram. The median value is indicated by a central horizontal and the lower and upper qualities by the corresponding horizontal ends of the box. *Indicates outlying value, inconsistent with other points in the sample.

