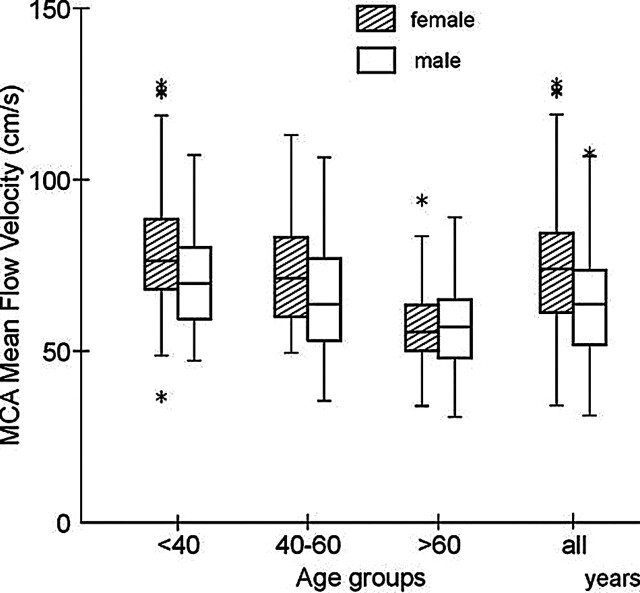
Fig 2.
Distribution of mean blood flow velocities in the MCA for women and men in the three age groups and in 304 healthy subjects. Mean velocity is higher in women up to the age of 60 years, and in older subjects, mean velocities are substantially lower and similar in both sexes. A description of box-and-whisker plot is provided in Figure 1.

