
Fig 6.
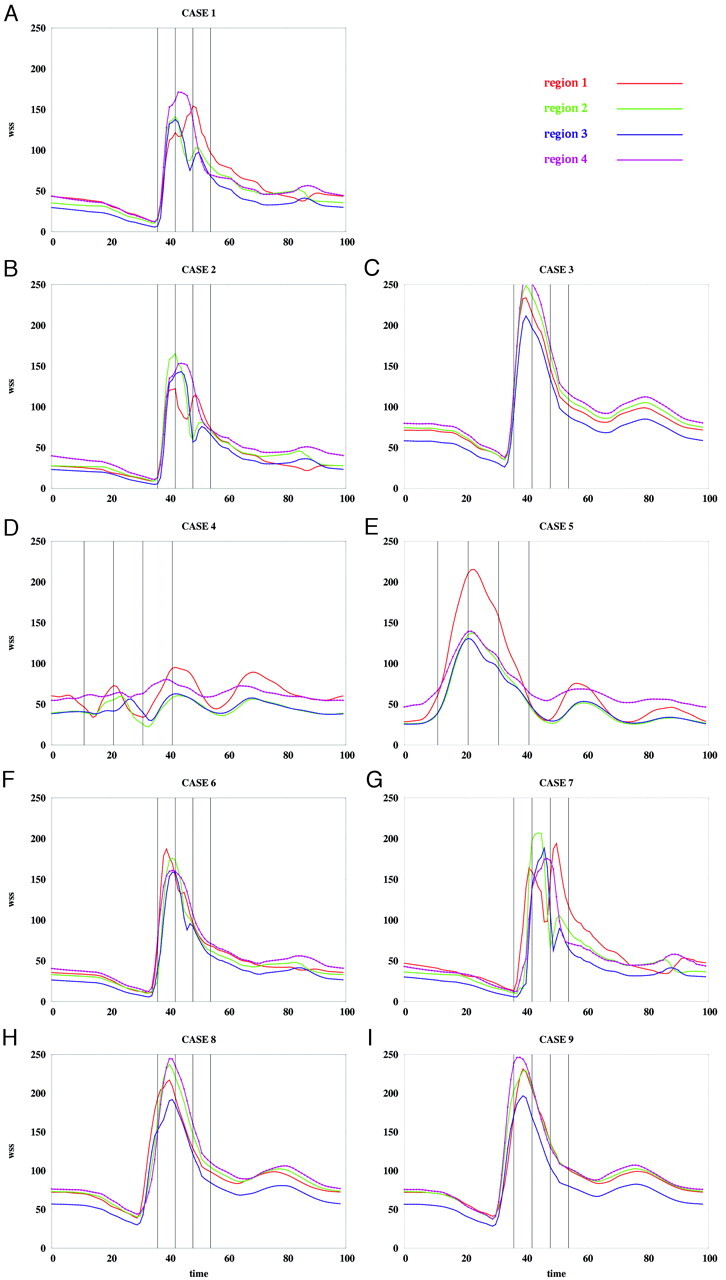
Average WSS magnitude over each region of patient 2 for the flow conditions listed in the Table. WSS magnitudes are in dynes per square centimeter, and time is in percentage of the cardiac cycle.
Official websites use .gov
A
.gov website belongs to an official
government organization in the United States.
Secure .gov websites use HTTPS
A lock (
) or https:// means you've safely
connected to the .gov website. Share sensitive
information only on official, secure websites.
Average WSS magnitude over each region of patient 2 for the flow conditions listed in the Table. WSS magnitudes are in dynes per square centimeter, and time is in percentage of the cardiac cycle.