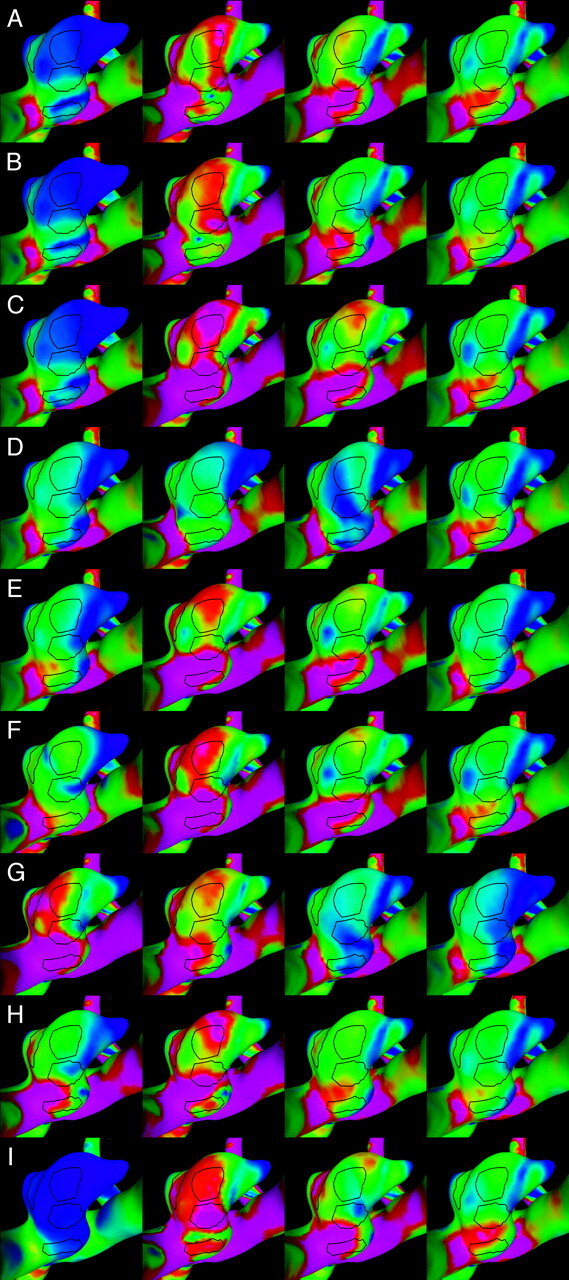
Fig 8.

Visualizations of the instantaneous WSS distribution over the aneurysm of patient 2. Each column corresponds to each of the 4 selected instants of time defined in Fig 6. Each row corresponds to each of the 9 flow conditions listed in the Table. The regions defined in Fig 4 (right) are also shown for reference. WSS magnitudes range from 0 (blue) to 200 dyne/cm2 (magenta).
