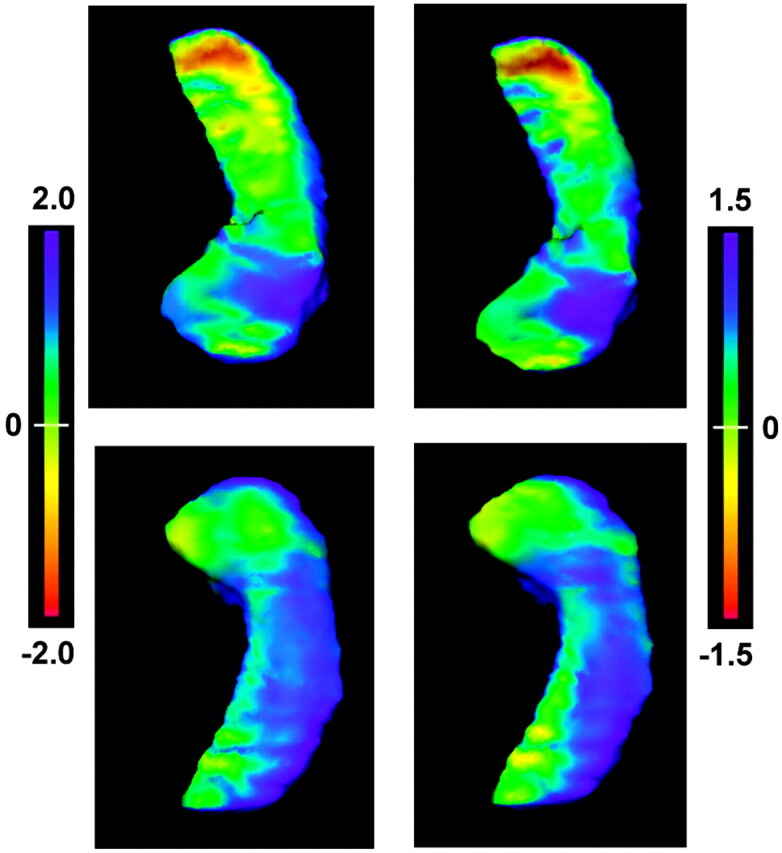
Fig 2.

The flame-scale hippocampus panels that display deformation patterns of the left MTS hippocampi. The left column shows the deformation pattern using all eigenvector coefficients, whereas the right column shows the deformation pattern after applying only the extreme positive coefficient from eigenvector 2. Top row, view from above. Bottom row, view from below. The deformation patterns are projected on the surfaces of the control hippocampi, with the flame scale representing (in millimeters) the surface differences between the MTS hippocampi and control hippocampi. The patterns of deformation show marked similarity, demonstrating that the positive component of eigenvector 2 largely represents the deformation changes accounting for differences in the left MTS hippocampi.
