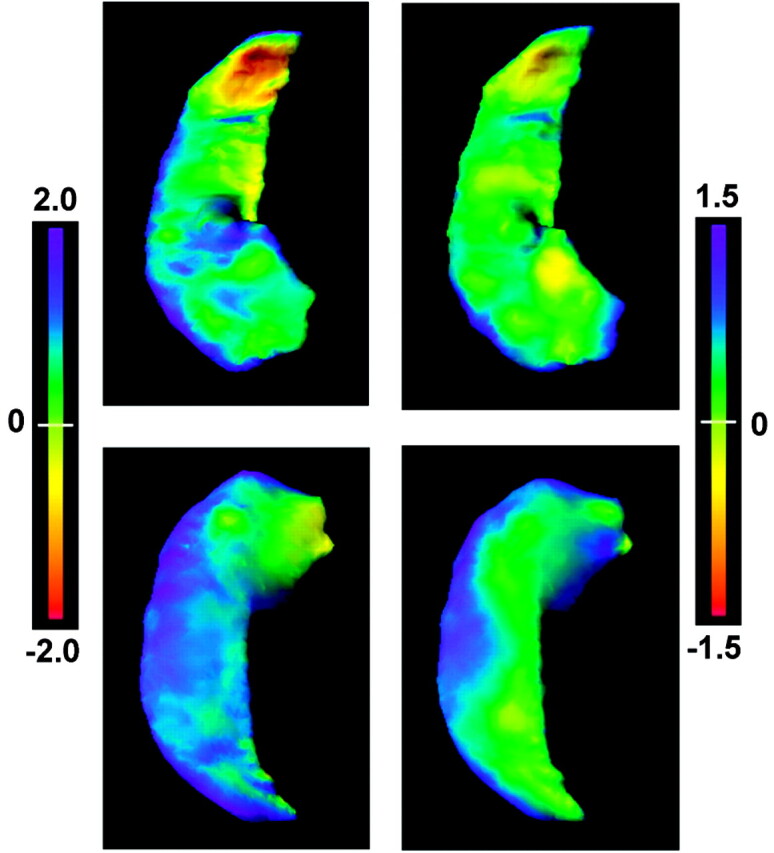
Fig 3.

The flame scale hippocampus panels, presented in a similar fashion as in Fig 2, showing deformation patterns of the right MTS hippocampi. The left column shows the deformation pattern with application of all eigenvector coefficients, whereas the right column shows the deformation pattern after applying only the extreme negative coefficient from eigenvector 2. Flame scale units are measured in millimeters. As with the positive component of eigenvector 2 for the left MTS hippocampal deformation pattern, the negative component of eigenvector 2 largely represents the deformation changes accounting for the differences in the right MTS hippocampi.
