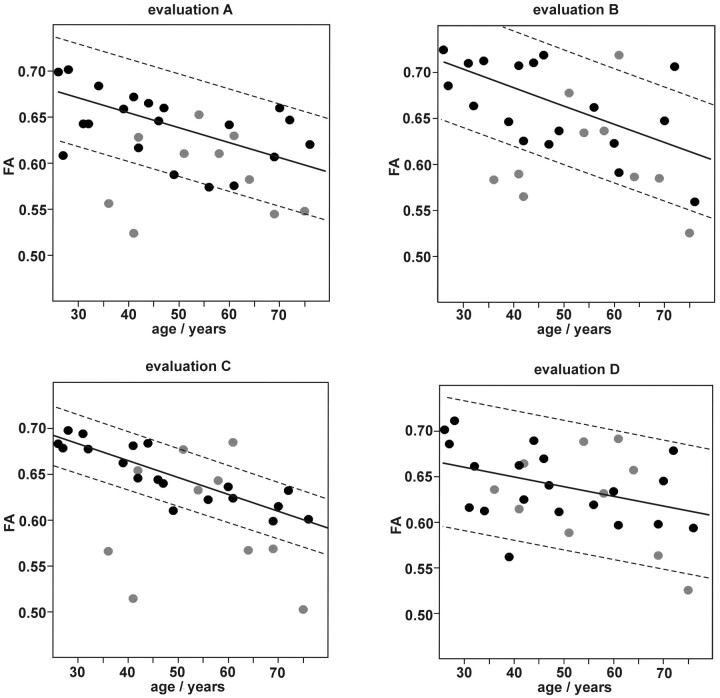
Fig 4.
FA as measured using evaluation strategies. A, B, C, and D are dependent on subject age. Mean values of corresponding measurements in the left and right branch of the CST. Black circles, control group. Gray circles, patients with ALS. Lines, linear regression of the control group with 95% confidence range.

