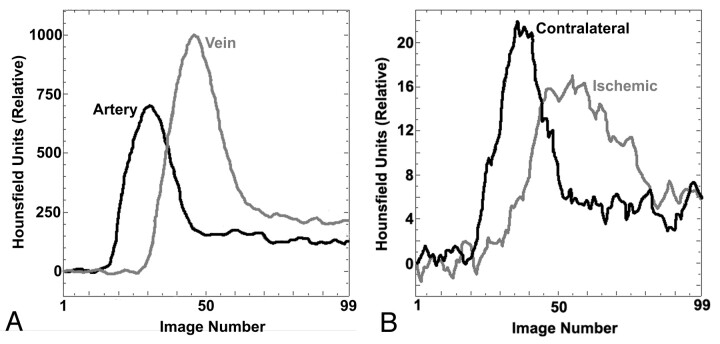
Fig 1.
Time attenuation curves from CT perfusion study of a rabbit showing enhancement (above baseline value) of various regions over the 99 sequential images acquired. Arterial and venous time-attenuation curves (A) and tissue time-attenuation curves (B) for 9-mm2 regions of interest in the ischemic hemisphere and contralateral hemisphere.

