
Fig 2.
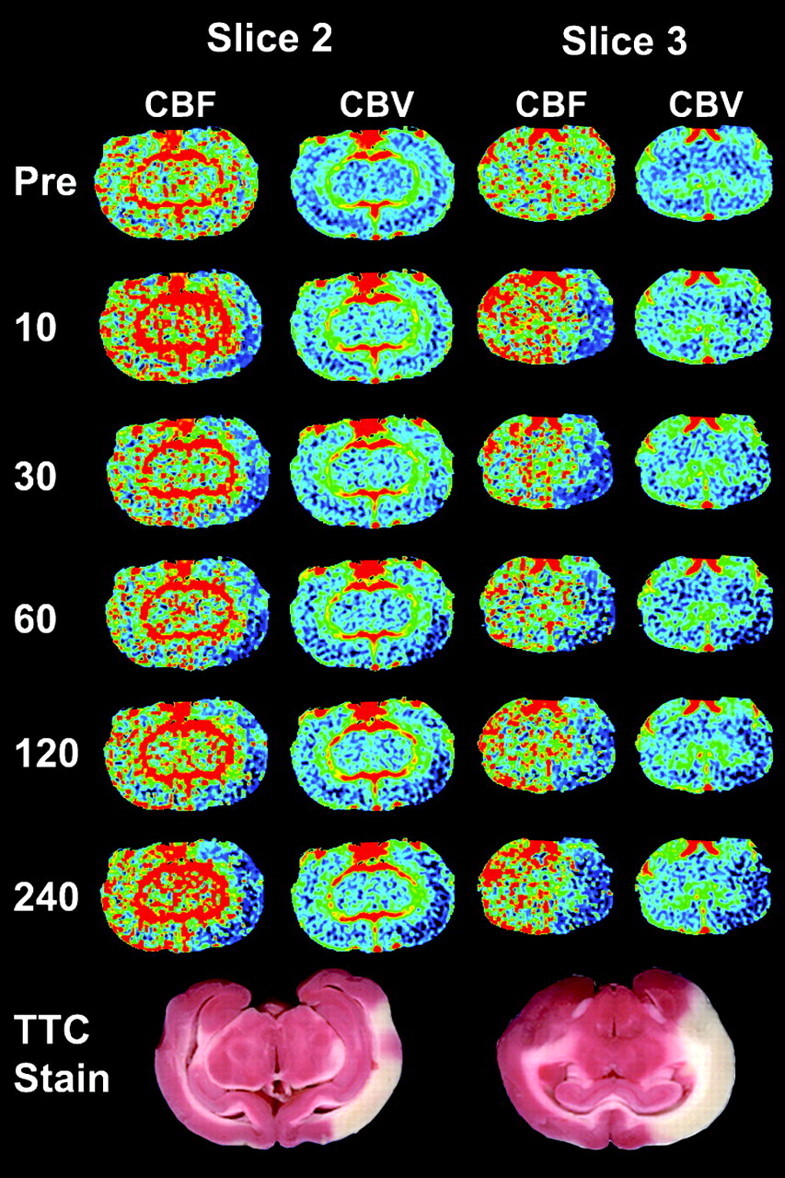
Serial CBF and CBV images from select time points (minutes poststroke on left) for 2 contiguous CT perfusion sections from 1 animal. Corresponding TTC staining shows infarcted tissue (white) corresponding to areas of decreased CBF and CBV, whereas viable tissue is stained red. CBF and CBV images are colored according to a “rainbow” color scale with red and blue representing high and low values, respectively: CBF, 0–150 mL · 100 g−1 · min−1; CBV, 0–10 mL · 100 g−1.