Fig 3.
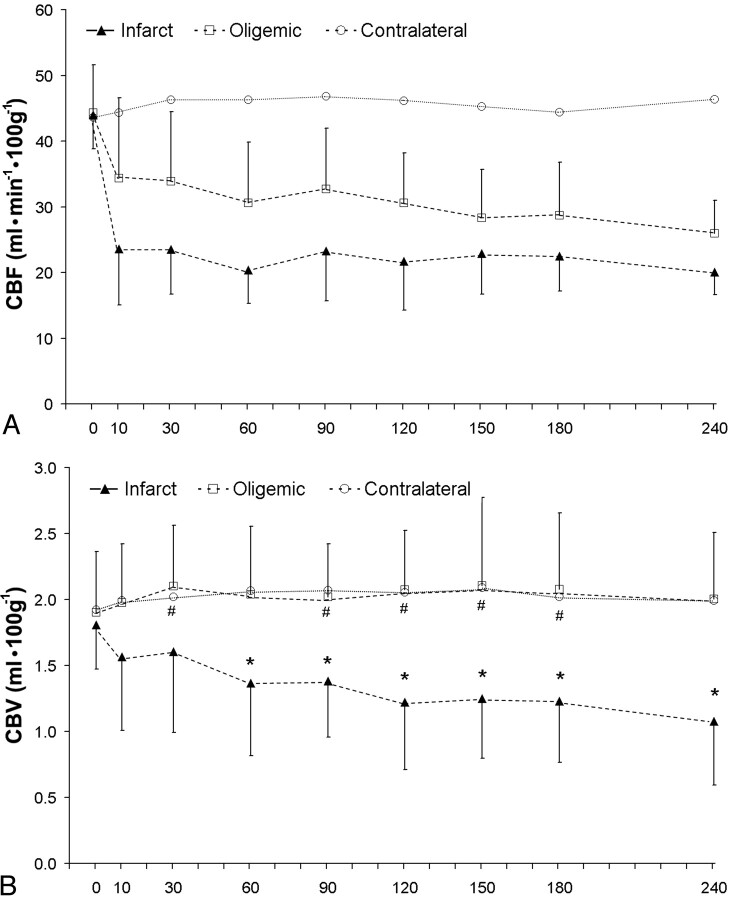
Average values of CBF (A) and CBV (B) in infarcted (n = 32) and oligemic (n = 45) regions of interest at different times after embolization; error bars show SD. For comparison, CBF and CBV of contralateral tissue are also shown (error bars not shown for clarity).
A, CBF is significantly lower than baseline at every time point after embolization in both oligemic and infarct regions. Contralateral CBF is not significantly different from baseline at any time point.
B, CBV in infarcted regions is significantly lower (P < .05) than baseline at 60 minutes after embolization and at every subsequent time point (*). CBV for oligemic regions was significantly higher than baseline values at 30, 90, 120, 150, and 180 minutes after embolization (#). No significant differences in CBV between oligemic and contralateral regions were found at any time point.

