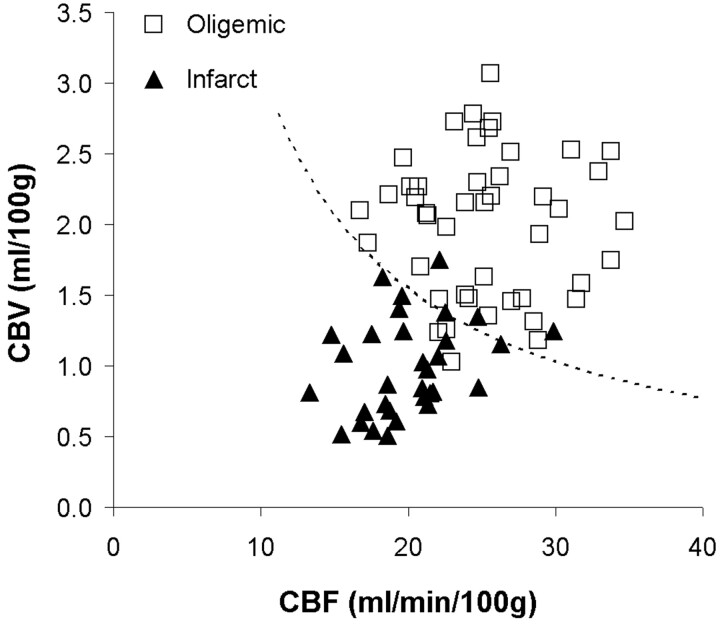
Fig 4.
Scatter plot of cerebral blood volume (CBV) versus cerebral blood flow (CBF) in oligemic and infracted tissue. Dashed line, CBF×CBV = 31.1, defines the threshold of infarction for the CBF×CBV model. Data points above the line are classified as oligemic, and points below the line are classified as infarct. When the predicted group membership is compared with the true group membership (defined on the TTC-stained tissue sections), the specificity and sensitivity of the model for infarction are 93.3% and 90.6%, respectively.

