
Fig 6.
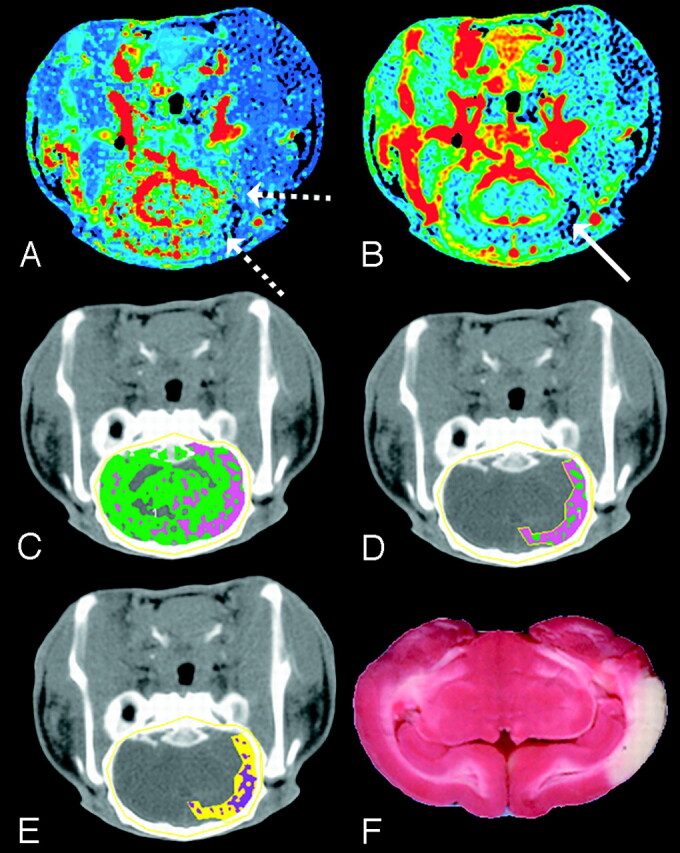
Matched decrease in CBF and CBV at 4 hours after embolization. The CBF and CBV maps display the corresponding functional values according to a “rainbow” color scale with red and blue representing high and low values, respectively (CBF, 0–150 mL · 100 g−1 · min−1; CBV, 0–10 mL · 100 g−1). CBF map (A) shows ischemic areas (dashed arrows) and CBV map (B) shows decreased blood volume in ischemic area (solid arrow) relative to contralateral hemisphere (C) brain tissue segmented from skull in the nonenhanced CT image by a CT number threshold of 340 HU and further classified according to CBF: 0 < pink pixels ≤ 25 > green pixels < 100 mL · 100 g−1 · min−1.
D, A manually drawn region of interest around the ischemic area.
E, The ischemic region shown in D classified according to the logistic regression model (purple pixels = infarct; yellow pixels = oligemic).
F, The corresponding TTC-stained tissue section shows an area of infarction that corresponds with pixels classified as infarct in E.