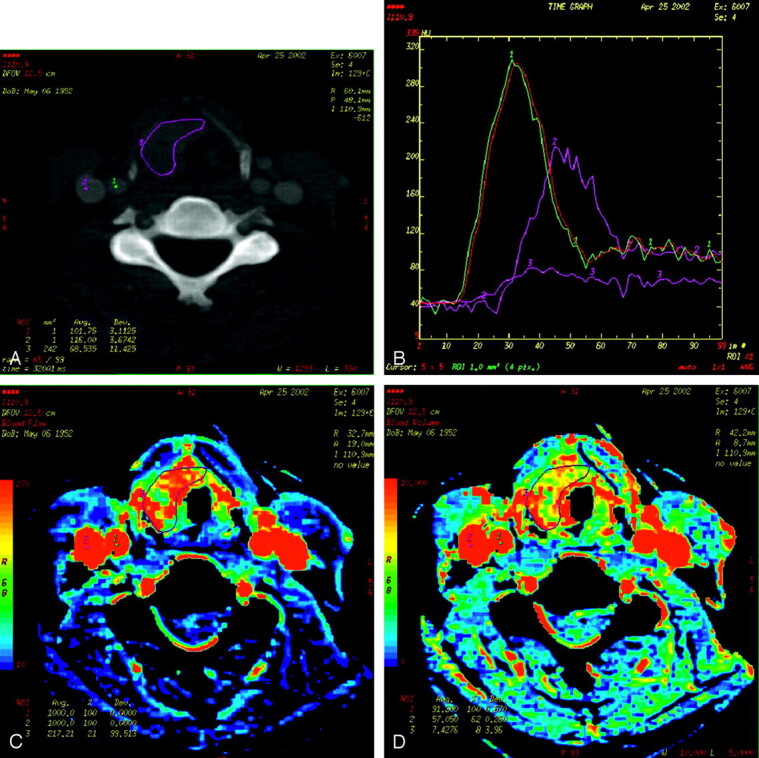
Fig 1.

Examples of CT perfusion images for a patient with squamous cell carcinoma of the epiglottis.
A, Regions of interest are drawn within the ipsilateral internal carotid artery (1), internal jugular vein (2), and around the tumor margins (3).
B, Concentration curves of the previously selected regions of interest are plotted with Hounsfield units on the y-axis and time on the x-axis.
C, Corresponding BF map of the neck at the level of the epiglottic tumor.
D, Corresponding BV map of the neck at the level of the epiglottic tumor.
