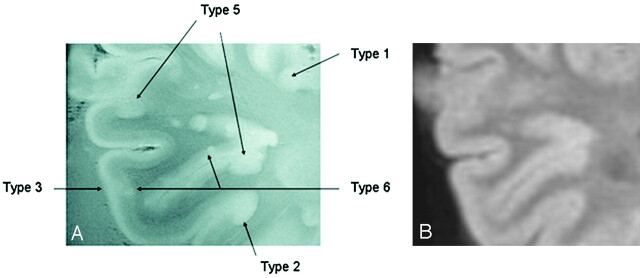
Fig 7.
A, GRE T2-weighted image, TR = 500, TE = 11, FOV = 15 cm, matrix = 1024 × 1024, and section thickness = 1 mm. Multiple patterns are evident within a region of interest in which 5 different patters of involvement of the cerebral cortex can be identified.
B, Corresponding FLAIR T2-weighted image at 1.5T for comparison fails to demonstrate the cortical lesions noted in A at 8T.

