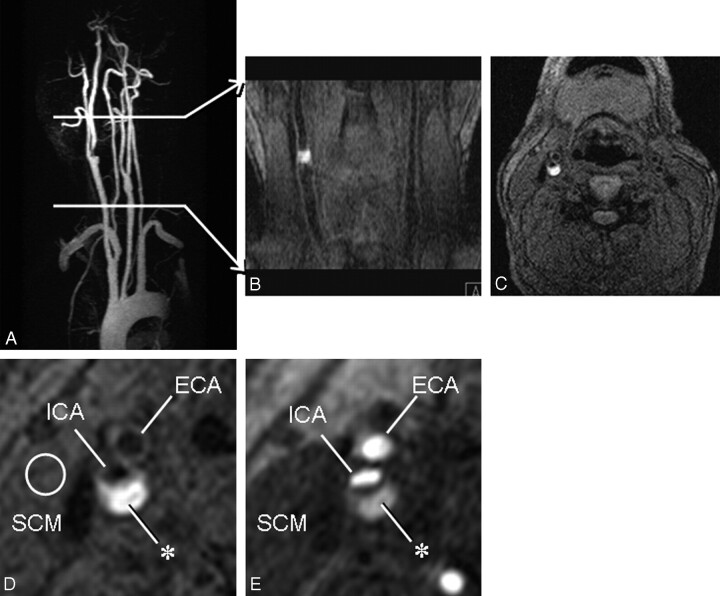
Fig 1.
Volume of plaque imaging.
A, Maximum intensity projection for contrast MRA of the cervical arteries. Volume of plaque imaging with MPRAGE is indicated between the 2 transverse bars.
B, Near-coronal multiplanar reconstruction of MPRAGE.
C, Source image of MPRAGE 3 mm cranial to the right carotid bifurcation shows relatively homogeneous signal intensity in the neck.
D, Zoomed source image of MPRAGE demonstrates dark lumen of the right internal carotid artery (ICA) and the external carotid artery (ECA). Circle indicates region of interest placed in the SCM.
E, Zoomed source image of TOF MRA at the same position demonstrates bright lumen of the carotid arteries. Plaque of the ICA (asterisk) demonstrates signal hyperintensity. SCM, sternocleidomastoid muscle.

