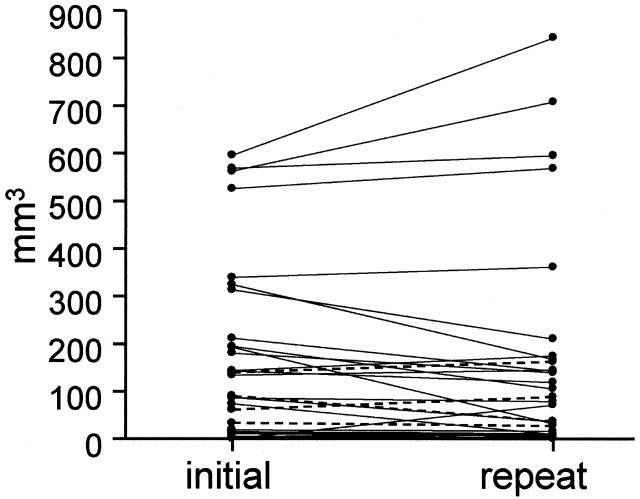
Fig 3.
Comparison of high signal intensity volume between successive MR imaging. Comparison was done 34 times between 2 successive MR imagings with high signal intensity in both or either of the 2 MR images. Median interval was 279 days (range, 10–1037 days). High signal intensity volume (mean ± SD) was 149 ± 182 mm3 at the initial MR imaging and 144 ± 217 mm3 at the repeat MR imaging. Paired t test displayed no significant change (P = .690). Broken lines indicate 4 carotid arteries associated with subsequent events within 1 year after initial MR imaging.

