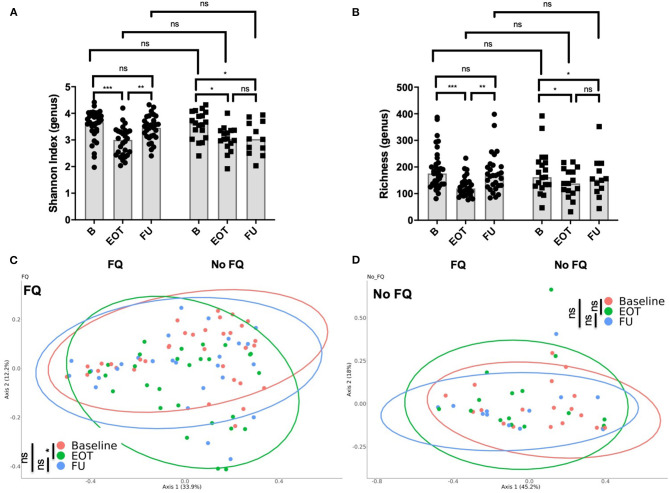
Figure 4.
Impact of the use of fluoroquinolone (FQ) on gut microbiota composition. (A) Shannon index distribution (genus level) at the end of treatment and at follow-up (15 days after antibiotic withdrawal) according to exposition to FQ; Wilcoxon test for paired comparison and, Mann-Whitney test for inter-group comparisons. (B) Richness (genus level) at the end of treatment and at follow-up (15 days after antibiotic withdrawal) according to exposition to FQ; Wilcoxon test for paired comparison and, Mann-Whitney test for inter-group comparisons. Principal coordinate analysis of Bray–Curtis distance at three different times of sampling for (C) patients treated with FQ or (D) without FQ; permutational multivariate analysis of variance. B, baseline; EOT, end of treatment; FU, follow-up. *p < 0.05; **p < 0.01; ***p < 0.001.

