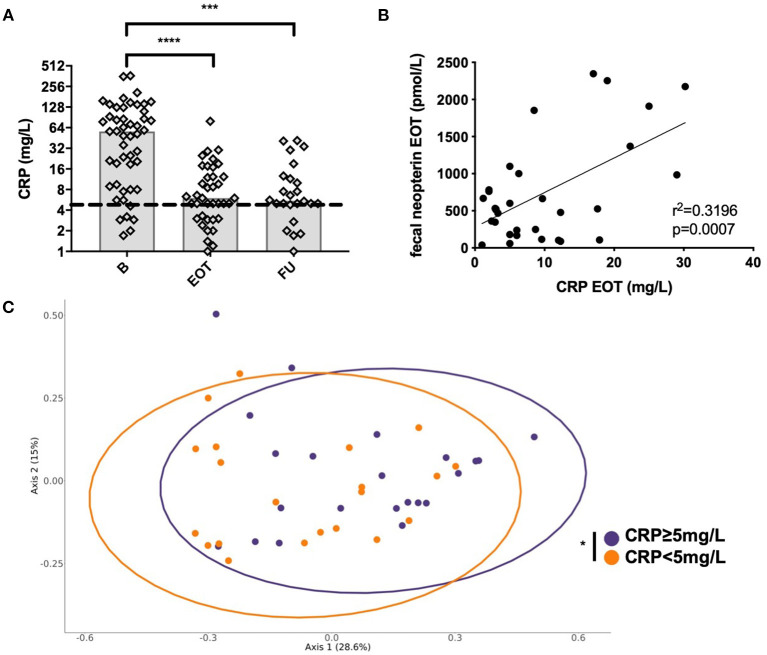
Figure 6.
Correlation between systemic and mucosal markers of inflammation. (A) Evolution of the plasmatic level of C-reactive protein (CRP) at different time points. (B) Correlation between fecal neopterin and plasmatic CRP; simple linear regression. (C) Principal coordinate analysis of Bray–Curtis distance between patients with each sample colored according to plasmatic CRP level at the end of treatment; permutational multivariate analysis of variance. B, baseline; EOT, end of treatment; FU, follow-up. *p < 0.05; **p < 0.01; ***p < 0.001; ****p < 0.0001.

