Figure 2.
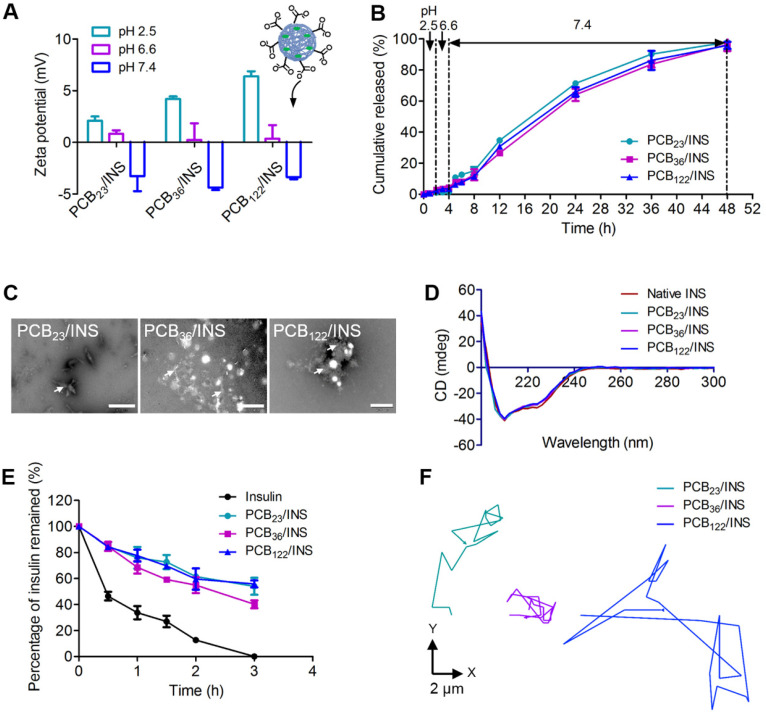
The release and activity of insulin. (A) The zeta potential of particles at different pH microenvironments. (B) Release profiles of insulin from particles at distinct pH microenvironment. (C) TEM images of PCB/INS particles in phosphate buffer saline (PBS) (pH 7.4) after 24 h incubation. The particles were negatively stained with phosphotungstic acid. The white arrows indicated the fragments. The scale bar was 500 nm, 1 µm and 200 nm for PCB23/INS, PCB36/INS and PCB122/INS particles image, respectively. (D) CD spectra of the native insulin and insulin released from the particles. (E) The percentage of insulin undergraded at different time points in the trypsin solution. (F) Representative motion trajectories of the PCB23/INS, PCB36/INS and PCB122/INS particles with FITC-labeled insulin in mucus at a time lapse of 7 s. The mean ± SD was shown (n = 3).

