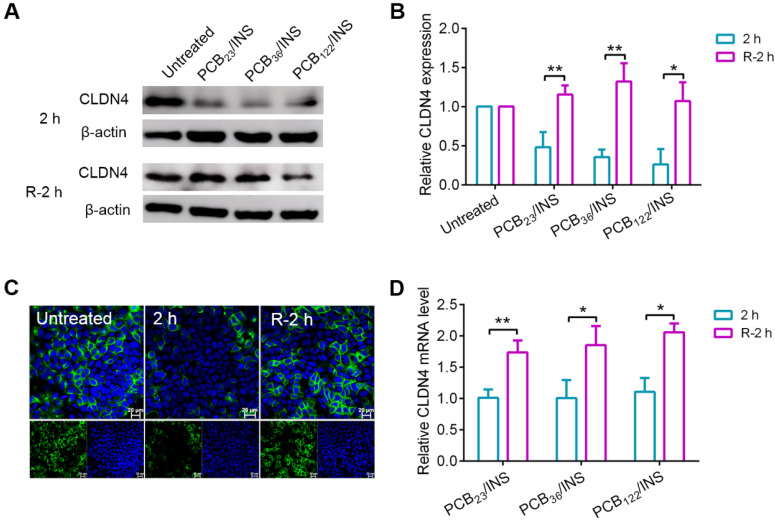
Figure 4.
The CLDN4 protein and mRNA level of Caco-2 cell monolayers after treatment. (A) Western blot results of CLDN4 after 2 h of PCB23/INS, PCB36/INS and PCB122/INS particles incubation at a concentration of 5 µg PCB/mL or removing. (B) Western bands were scanned and normalized to the gray values of internal control β-actin. Quantified results of CLDN4 in (A) using ImageJ. The data was relative to the untreated control in each Western band. The untreated control was settled to 1. (C) Fluorescence images collected by CLSM after 2 h of PCB122/INS particles treatment or removal. CLDN4 was shown in green, and cell nuclei stained with DAPI were in blue. (D) Relative CLDN4 mRNA level in Caco-2 cells after 2 h of PCB23/INS, PCB36/INS and PCB122/INS particles incubation or removal. The mean ± SD was shown (n = 3). *P < 0.05, **P < 0.01.

