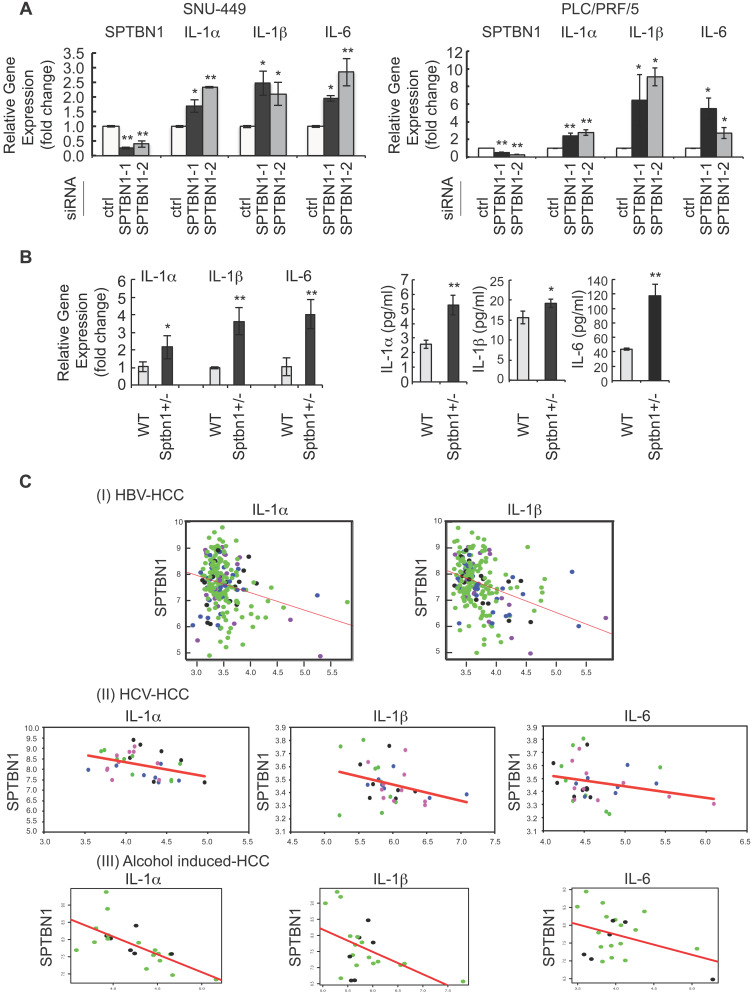
Figure 1.
An increase in inflammatory cytokines was observed in human HCC cells and in liver tissues of Sptbn1+/- mice, and an inverse correlation of SPTBN1 with IL-1α, IL-1β and IL-6 was observed in human HCV- and HBV- induced HCC as well as alcohol- induced HCC tissues. (A) PLC/PRF/5 and SNU449 cells transiently transfected with control siRNA or siRNA to SPTBN1 were cultured for 48 hours and subjected to QRT-PCR analysis for IL-1α, IL-1β and IL-6 mRNA. Significance of the mean value difference was determined using a Student's t test (*P < 0.05; **P < 0.01 compared with the control siRNA group). (B) QRT-PCR analysis of IL-1α, IL-1β and IL-6 mRNA in liver tissues from WT and Sptbn1 +/- mice (n = 5) (left). The normalized fold-change (mean ± S.D.) (comparing to WT group) were shown. The release of cytokines in cell culture medium of primary culture from single cell suspensions prepared from mouse liver tissues was measured by ELISA assay (right). The significance of the difference between WT and Sptbn1+/- livers with respect to cytokines in mRNA levels in tissues and the released protein expression in culture was determined using a Student's t test (*P < 0.05; **P < 0.01). (C) Correlation analysis of gene expression in human HBV- and HCV- induced HCC tissues using G-DOC platform. Tumor stages of the analyzed human HBV- and HCV-induced HCC cases are indicated by different dot colors: blue, very early HCC; green, early HCC; purple, very advanced HCC; and black, advance HCC. The human HBV-induced HCC data set consisted of 225 liver tumor samples and 220 paired non-tumor samples with clinical and gene expression data (I). The human HCV-induced HCC data set consisted of 75 samples representing stepwise carcinogenic processes from pre-neoplastic lesions to HCC. Of these, 33 samples including very early, early, advanced, and very advanced HCC were considered for analysis (II). The human alcohol-induced HCC data set consisted of 22 samples. Raw gene expression data was obtained from Gene expression omnibus (GEO). The correlation scatter plots were colored data based “Edmonson Grade” clinical attribute - which had values either Grade I/II-black dots or Grade II/III-green dots (III). Correlation coefficients (r) and p-values between two groups of genes selected from SPTBN1, IL-1α, IL-1β and IL-6 were obtained using Pearson correlation tests.

