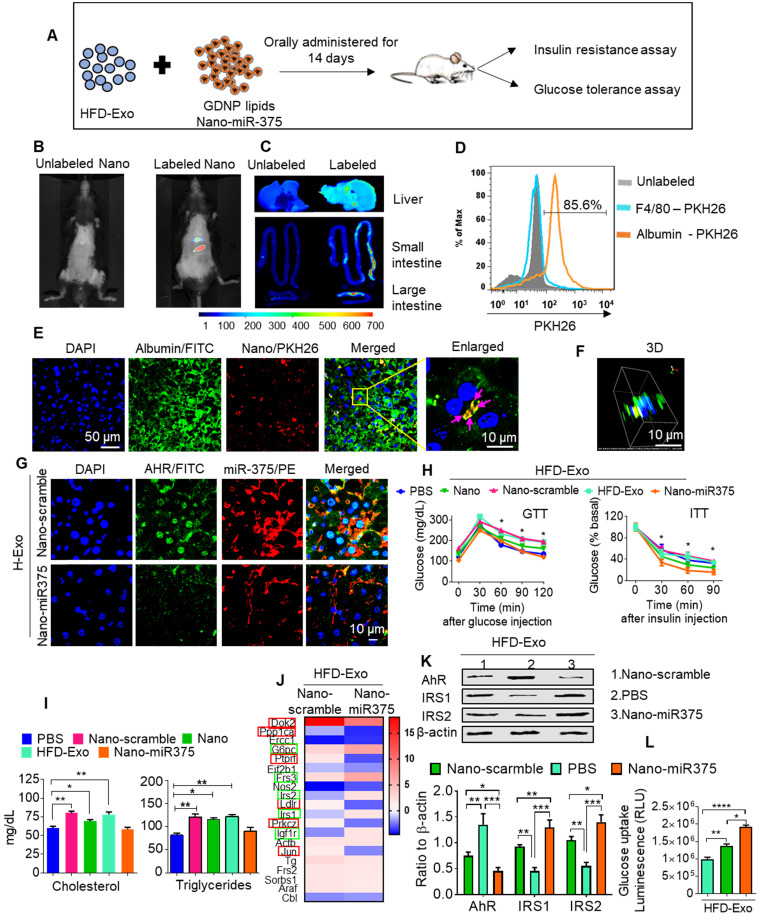
Figure 6.
miR-375 improves insulin sensitivity and glucose homeostasis and prevents dyslipidemia. (A) Graphical representation of the experiment, which consisted of adoptive transfer of CD63+A33+ fecal exosomes (HFD-Exo) from HFD mouse (HFD fed 12 months) plus nanoparticles containing miR-375. Nanoparticles generated using the total lipid from GDNP. (B) Live imaging of mice orally administered PKH26 labeled nanoparticles containing miR-375. (C) Imaging of the liver, small and large intestines indicating the presence of labeled nanoparticles 6 hours after oral administration. (D) PKH26 labeled nanoparticle uptake by hepatocytes (albumin-positive cells) or Kupffer (F4/80-positive) cells. (E) Representative images of cellular uptake of PKH26-labeled nanoparticles by hepatocytes (albumin-positive cells). PKH26-labeled particles are indicated by pink arrows. (F) 3D image of PKH26-labeled nanoparticles in hepatocytes. (G) Confocal imaging to detect AhR (FITC) and biotinylated miR-375 or scrambled microRNA in liver tissues derived from mice orally administered nanoparticles. (H) GTT and ITT for C57BL/6 mice that received the fecal exosomes (HFD-Exo) along with nanoparticles containing miR-375 or scrambled RNA for 14 days while the mice were fed a HFD. Statistical comparisons were made between HFD-Exo vs Nano-miR375; HFD-Exo was responsible for insulin resistance and miR-375 responsible for preventing the development of insulin resistance. Nanoparticles contained scramble RNA (Nano-scramble); nanoparticles only (Nano); and nanoparticles contained miR-375 (Nano-miR375). (I) Cholesterol and triglyceride levels in plasma derived from HFD mice treated with either PBS or nanoparticles (above mentioned) for 14 days. (J) Insulin signaling array of mouse hepatocytes cultured with fecal exosomes (HFD-Exo) along with nanoparticles (contained scramble & nano-miR-375) showing alterations in genes involved in insulin signaling. Green-boxed genes promote insulin activity and red-boxed genes inhibit insulin activity. (K) Western blot depicting Foxa2, AhR, and IRS-1 and 2 expression in hepatocytes treated with fecal exosomes (HFD-Exo) along with nanoparticles (contained scramble & nano-miR-375). The ratio to β-actin is shown in bar graph form as part of panel K. (L) Effect of fecal exosomes (HFD-Exo) on glucose uptake by hepatocytes. One-way ANOVA with a Bonferroni correction for multiple comparisons test was used to calculate statistical significance. (p value *<0.05; **<0.01; ***<0.001; ****<0.0001).

