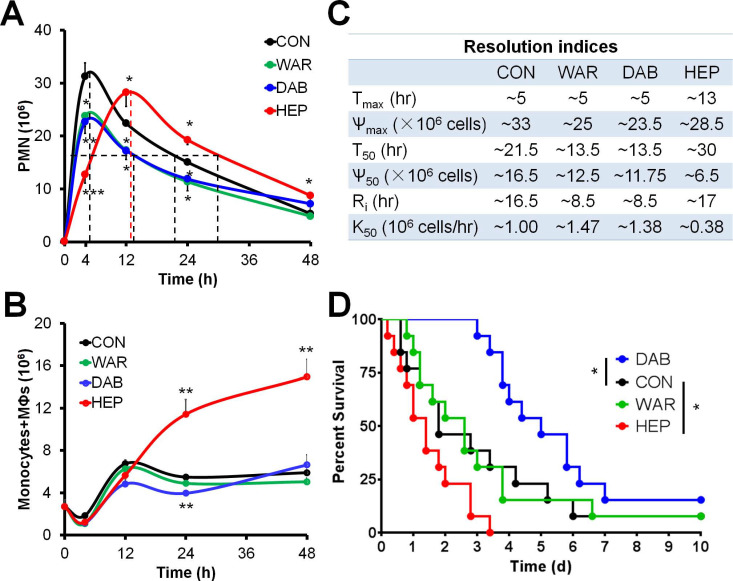
Figure 2.
Warfarin, dabigatran and heparin differentially regulate inflammation resolution. (A-C) C57BL/6N mice were challenged with zymosan (Zym, 1mg i.p.) with PBS (control; CON), warfarin (WAR, 200 µg/kg), dabigatran (DAB, 200 µg/kg), and heparin (HEP, 200 IU/mouse). Peritoneal numbers of PMN (A), monocytes and macrophages (B) at indicated intervals were counted and resolution indices were calculated (C). See reference No. 10 for calculation methods of resolution indices. Tmax: time point when PMN infiltration to maximum; Ѱmax: PMN maximum number; T50: time point when PMN reduction to half of Ѱmax; Ѱ50: 50% of Ѱmax; Ri: resolution interval, time interval from Tmax to T50; K50: the rate of PMN reduction from Tmax to T50. Error bars represent mean ± S.E.M. (D) Survival rates of CLP mice (n = 13 in each group) treated (i.v.) with PBS (control; CON), WAR (200 µg/kg), DAB (200 µg/kg), or HEP (200 IU/mouse). Mantel-Cox test was applied for the P values of survival experiments. *P < 0.05; **P < 0.01; ***P < 0.001; ****P < 0.0001 vs. control.

