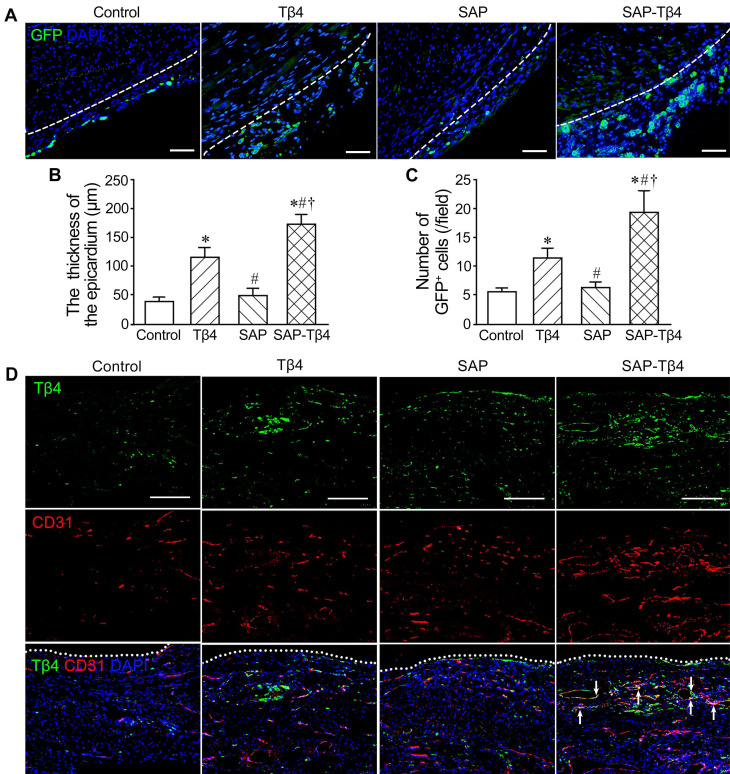
Figure 6.
The activated epicardium and Tβ4+ cells in the epicardium and myocardium at 1 week after implantation. (A) The epicardium and GFP+ EPDCs. Immunostaining. The dotted lines indicate the junction between the epicardium and myocardium. Scale bar = 50 µm. (B) Statistical result of the thickness of the epicardium. (C) Statistical result of the number of EPDCs in the epicardium. *p < 0.05 versus control group; #p < 0.05 versus Tβ4 group; †p < 0.05 versus SAP group. n ≧ 5. (D) Tβ4 expression in the epicardium and myocardium. Immunostaining. Tβ4 is mainly expressed in the vascular endothelial cells (arrows) near the epicardium. The dotted lines indicate the surface of the epicardium. Scale bar = 200 µm.

