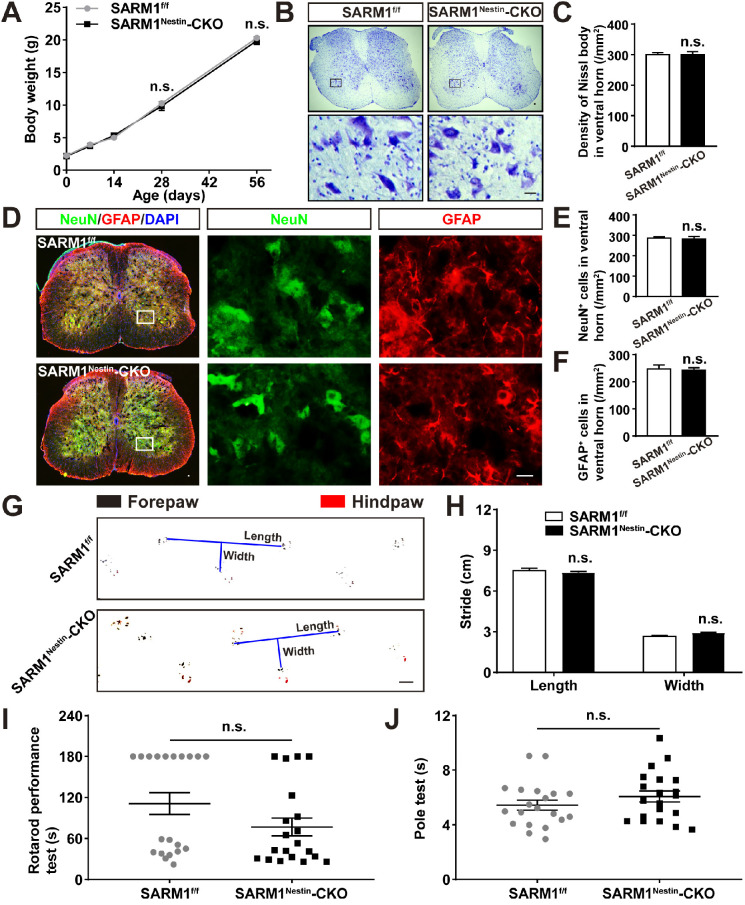
Figure 2.
Normal development of spinal cords and motor function of SARM1Nestin-CKO mice. (A) Quantitative analysis of the body weight of SARM1f/f and SARM1Nestin-CKO mice at different developmental stages (two-way ANOVA (repeated measures) with Bonferroni's post-tests, n = 3 per group). (B) Nissl staining images showing the nissl bodies in the ventral horn of the spinal cords of 2 M male SARM1f/f and SARM1Nestin-CKO mice. (C) Quantitative analysis of the number of neurons as shown in (B) (n = 6 per group). (D) Double immunostaining analysis of NeuN (green) and GFAP (red) in the ventral horn of the spinal cords of 2 M male SARM1f/f and SARM1Nestin-CKO mice. (E-F) Quantitative analysis of the number of NeuN+ or GFAP+ cells as shown in (D) (n = 6 per group). (G) Representative footprint images of 2 M male SARM1f/f and SARM1Nestin-CKO mice. (H) Quantitative analysis of stride length and stride width in footprint assays of 2 M male SARM1f/f and SARM1Nestin-CKO mice as shown in (G) (n = 6 per group). (I) Quantitative analysis of the time taken to fall in rotarod performance test of 2 M male SARM1f/f and SARM1Nestin-CKO mice (n = 20 per group). (J) Quantitative analysis of the time all the four limbs took to land on in the pole test of 2 M male SARM1f/f and SARM1Nestin-CKO mice (n = 20 per group). Images of selected regions (rectangles) in (B) and (D) were shown at higher magnification. Scale bars, 20 µm (B, D), 1cm (G). Data were mean ± SEM. Two-tailed Student's t-test, n.s. not significant (P > 0.05).

