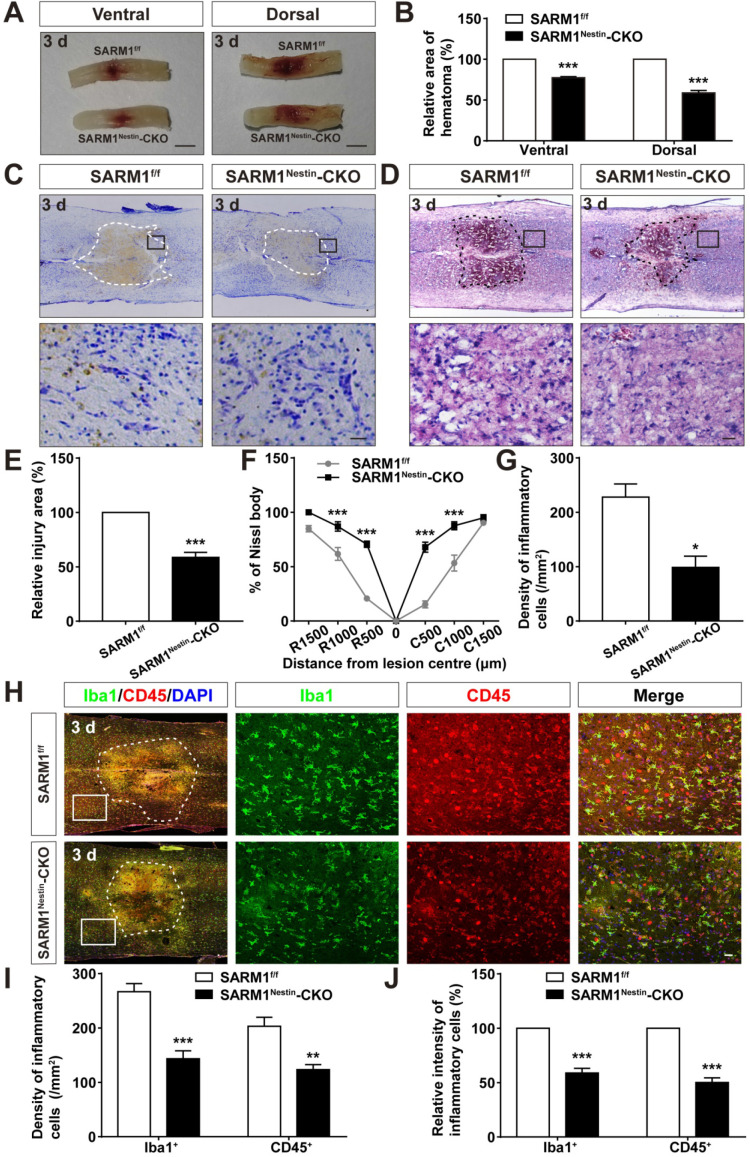
Figure 6.
Conditional deletion of SARM1 in neurons and astrocytes reduced the neuroinflammation at SCI early phase. (A) Representative images of the ventral and dorsal spinal cords with hematoma of SARM1f/f and SARM1Nestin-CKO mice at 3 d after SCI. (B) Quantitative analysis of hematoma area of the spinal cords as shown in (A) (n = 6 per group, normalized to SARM1f/f mice group). (C) Nissl staining images showing the injury area in the spinal cords of SARM1f/f and SARM1Nestin-CKO mice at 3 d after SCI. (D) HE staining images showing the inflammatory infiltration of the spinal cords of SARM1f/f and SARM1Nestin-CKO mice at 3 d after SCI. (E) Quantitative analysis of the injury area in the spinal cords as shown in (C) (n = 3 per group, normalized to SARM1f/f mice group). (F) Quantitative analysis of neurons by Nissl staining at various distances from the SCI lesion center as shown in (C) (two-way ANOVA (repeated measures) with Bonferroni's post-tests, n = 3 per group, normalized to SARM1f/f mice group). (G) Quantitative analysis of the density of inflammatory cells in the spinal cords as shown in (D) (n = 3 per group). (H) Double immunostaining analysis of Iba1 (green) and CD45 (red) in the spinal cords of SARM1f/f and SARM1Nestin-CKO mice at 3 d after SCI. (I) Quantitative analysis of the density of Iba1+ cells and CD45+ cells as shown in (H) (n = 6 per group). (J) Quantitative analysis of the intensity of Iba1+ cells and CD45+ cells as shown in (H) (n = 6 per group, normalized to SARM1f/f mice group). Dashed lines indicated the outline of the injury sites. Images of selected regions (rectangles) in (C), (D), and (H) were shown at higher magnification. Scale bars, 3 mm (A), 20 µm (C, D, H). Data were mean ± SEM. Two-tailed Student's t-test, *P < 0.05, **P < 0.01, ***P < 0.001.

