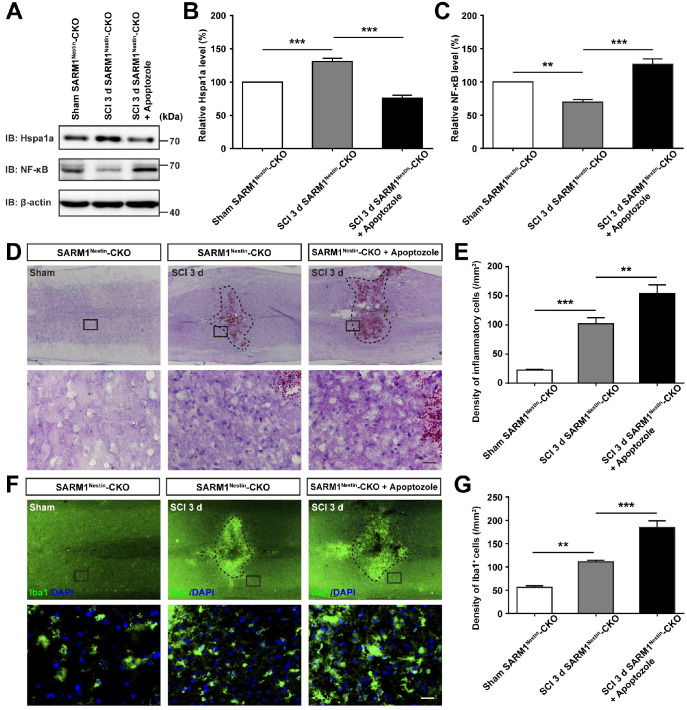
Figure 9.
Inhibition of HSP70 by apoptozole promoted neuroinflammation at SCI early phase. (A) Western blot analysis of the expression of Hspa1a and NF-κB in the uninjured spinal cords from SARM1Nestin-CKO mice or injured spinal cords at 3 d after SCI from control or apoptozole treated SARM1Nestin-CKO mice. (B-C) Quantitative analysis of the relative Hspa1a (B) and NF-κB (C) levels as shown in (A) (n = 6 per group, normalized to Sham SARM1Nestin-CKO mice group). (D) HE staining images showing the inflammatory infiltration of the uninjured spinal cords from SARM1Nestin-CKO mice or injured spinal cords at 3 d after SCI from control or apoptozole treated SARM1Nestin-CKO mice. (E) Quantitative analysis of the density of inflammatory cells in the spinal cords as shown in (D) (n = 6 per group). (F) Immunostaining analysis of Iba1 (green) in the uninjured spinal cords from SARM1Nestin-CKO mice or injured spinal cords at 3 d after SCI from control or apoptozole treated SARM1Nestin-CKO mice. (G) Quantitative analysis of the density of Iba1+ cells as shown in (F) (n = 6 per group). Dashed lines indicated the outline of the injury sites. Images of selected regions (rectangles) in (D) and (F) were shown at higher magnification. Scale bars, 20 µm. Data were mean ± SEM. Two-tailed Student's t-test, **P < 0.01, ***P < 0.001.

