. 2021 Feb 17;13(2):e13393. doi: 10.7759/cureus.13393

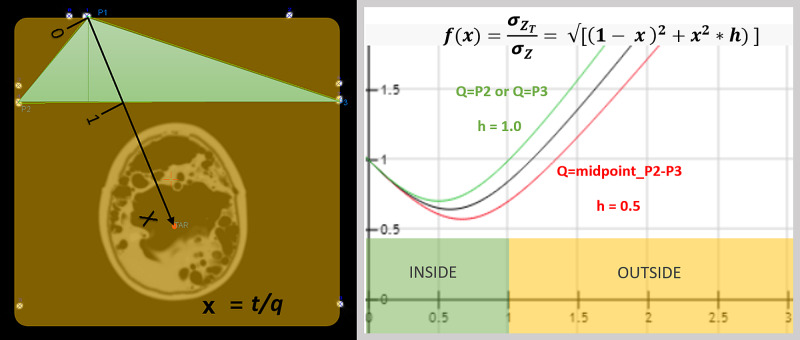
Figure 8. The function Inline graphic from equation 36, which demonstrates potential errors was derived using Barycentric coordinates. Left image shows an axial computed tomography (CT) image whereby the three diagonal rods form a triangle. The right image shows the function as it relates to the target position. One can observe that the function minimizes at the center of the triangle, which is the valley seen between Inline graphic of 0.5 to 1. When the target extends beyond Inline graphic outside the area of the triangle, the function increases. Therefore, the propagation of error is lower than 1 inside the triangle and increases outside it, getting larger the farther from the triangle the target is. From this observation, it is concluded that the probabilities that the target is within a triangle should be maximized. Or equivalently the area of the triangle should be maximized.

Figure 8