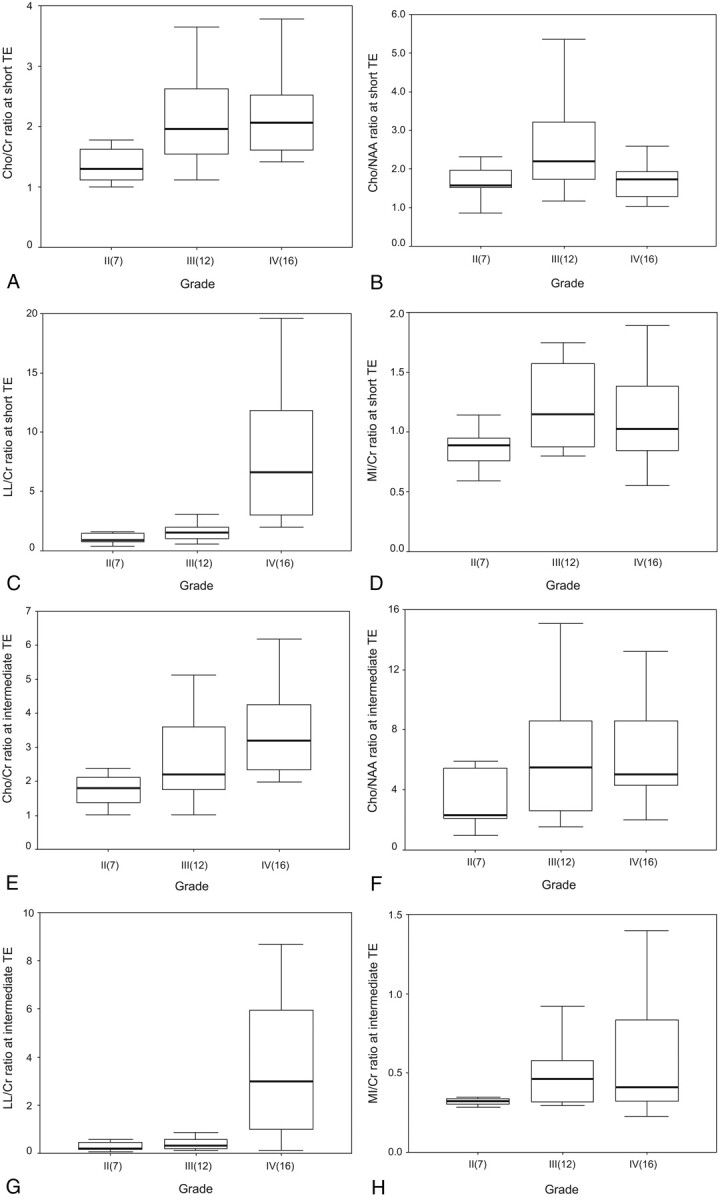
Fig 1.

Box plots of the ratios of the metabolites at both TE sequences in the patients with cerebral gliomas. The horizontal thick line is the median, the upper and lower ends of the boxes are the 3rd and 1st quartiles, and the vertical lines show the full range of values in the data. The extremes and outliers were omitted.
A, Cho/Cr at short TE; B, Cho/NAA at short TE; C, LL/Cr at short TE; D, mIns/Cr at short TE; E, Cho/Cr at intermediate TE; F, Cho/NAA at intermediate TE; G, LL/Cr at intermediate TE; H, mIns/Cr at intermediate TE.
