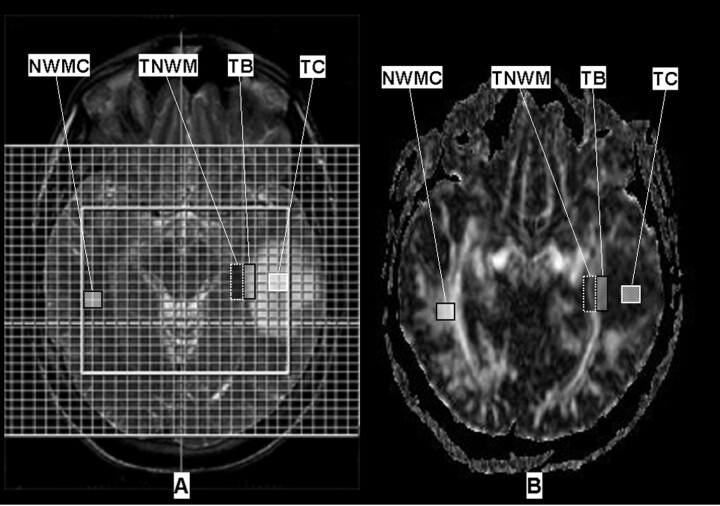
Fig 1.
A, Regions of interest were placed in the spectroscopic matrix on T2-weighted images (2720/126; 256 × 256 matrix; field of view, 230 × 230 mm; section thickness, 6 mm) in the tumor center (TC), the border of the tumor (TB), the normal-appearing white matter adjacent to the tumor (TNWM), and in the white matter of the contralateral hemisphere (NWMC).
B, After reslicing and coregristration with the T2-weighted images, the ROIs were transferred to the FA maps (4900/90 ms; 256 × 256 matrix; field of view, 230 × 230 mm; section thickness, 3 mm; b values, 0, 1500 seconds/mm2; EPI factor, 36).

