Fig 1.
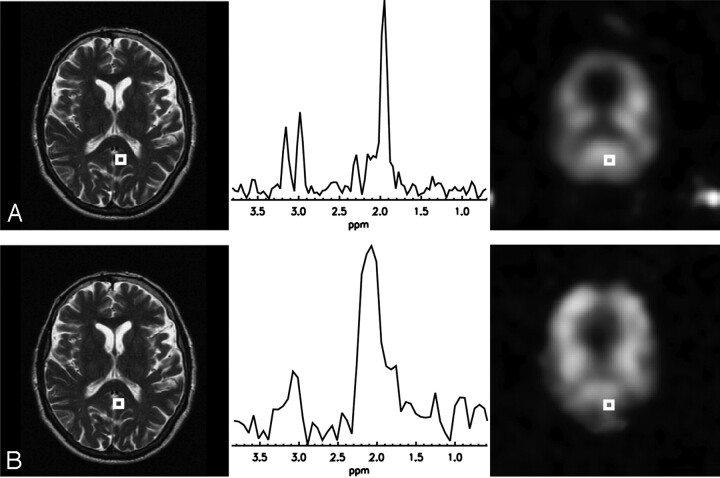
Comparison between 3T and 1.5T: multiple spin-echo MRSI data with ETL = 6 and an echo spacing of 144 ms acquired in the same healthy volunteer. Shown are the T2-weighted images, the creatine maps, and the spectra from the outlined voxel.
A, 3T data: The spectral sampling resolution of 8.9 Hz is sufficient to clearly resolve the creatine resonance at 3.0 ppm and the choline resonance at 3.2 ppm.
B, 1.5T data: Although the creatine map still shows some structure, the spectrum shows that an 8-Hz sampling resolution cannot distinguish the 2 resonances anymore.

