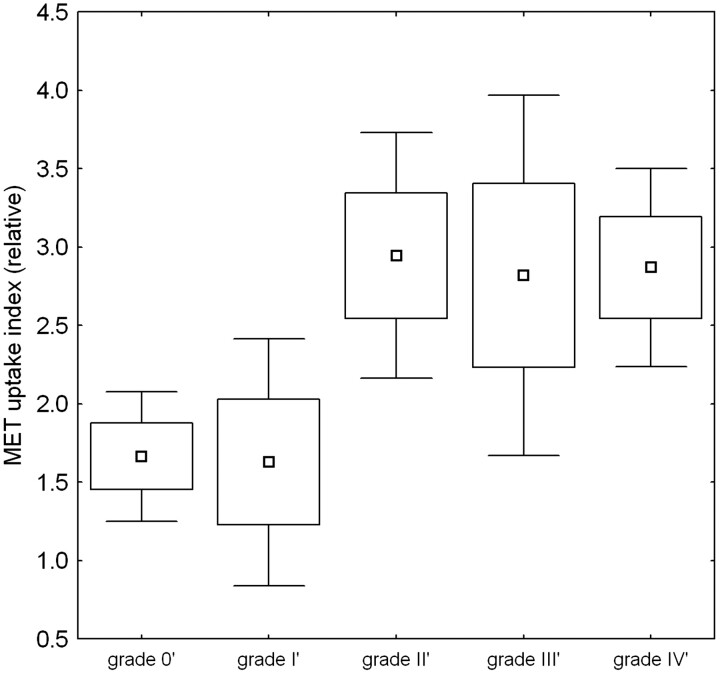
Fig 2.
[11C]Methionine maximum uptake index as a function of grading. Grading values are regrouped as indicated in the text. Grade 0′ (benign) and grade I′ (WHO grade I and intermediate grade I–II) show significantly reduced uptake compared with grade II′–IV′ lesions. Box plots show the mean value, and whiskers show the 95% confidence interval limits. Boxes show 1 SE; whiskers show the 95% confidence interval limits.

