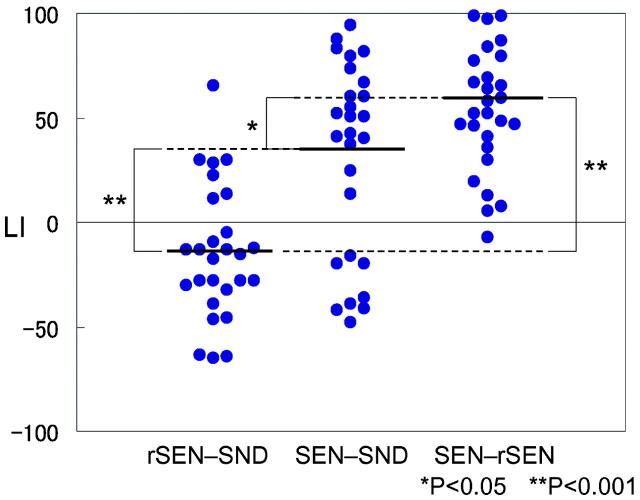
Fig. 3.
LI distribution of the temporal activation under rSEN-SND, SEN-SND, and SEN-rSEN contrasts: The bold line shows the mean of LI under each contrast. One-way ANOVA and multiple comparison by Bonferroni test for individual LI in temporal activation was significantly different among the 3 contrasts (ANOVA: F (2, 78) = 26.28, P < .001, Bonferroni: P < .05). *, P < .05; **, P < .001.

