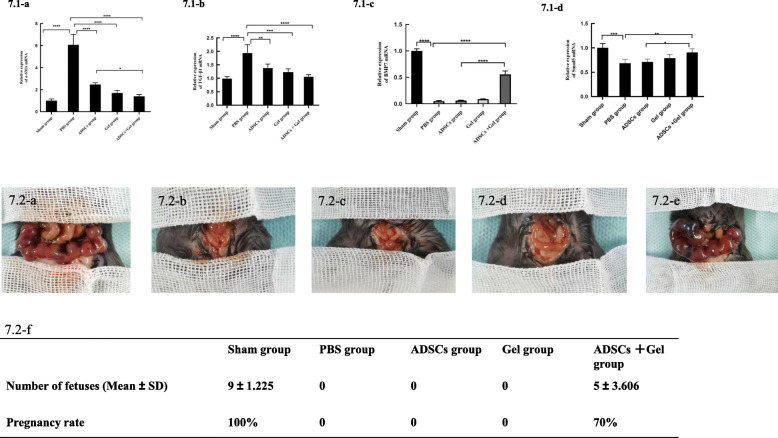
Fig. 7.
7.1-a Relative expression of α-SMA mRNA. Sham group, 1.008 ± 0.1544; PBS group, 0.1544 ± 0.9503; ADSCs group, 2.474 ± 0.1598; Gel group, 1.703 ± 0.2415; ADSCs + Gel, 1.398 ± 0.1797. 7.1-b Relative expression of TGF-β1 mRNA. Sham group, 1.001 ± 0.05932; PBS group, 1.951 ± 0.2980; ADSCs group,1.391 ± 0.1269; Gel group, 1.227 ± 0.1269; ADSCs + Gel, 1.068 ± 0.06639. 7.1-c Relative expression of BMP7 mRNA. Sham group, 1.001 ± 0.03872; PBS group, 0.05062 ± 0.01281; ADSCs group, 0.06124 ± 0.006388; Gel group, 0.08836 ± 0.005922; ADSCs + Gel, 0.5575 ± 0.06289. 7.1-d Relative expression of Smad5 mRNA. Sham group, 1.003 ± 0.08697; PBS group, 0.6843 ± 0.07691; ADSCs group, 0.7127 ± 0.05734; Gel group, 0.7891 ± 0.07409; ADSCs + Gel, 0.9066 ± 0.07593. *P < 0.05, **P < 0.01, ***P < 0.001, ****P < 0.0001, ns P >0.05. 7.2 Results of the mating experiment. Reproductive outcomes in the sham group (7.2-a), PBS group (7.2-b), ADSCs group (7.2-c), Gel group (7.2-d), and ADSCs + Gel group (7.2-e). The number of fetuses in each group was analyzed (7.2-f). Data are presented as mean ± SD. The pregnancy rate is equal to the number of pregnant uteri divided by the total number of uteri

