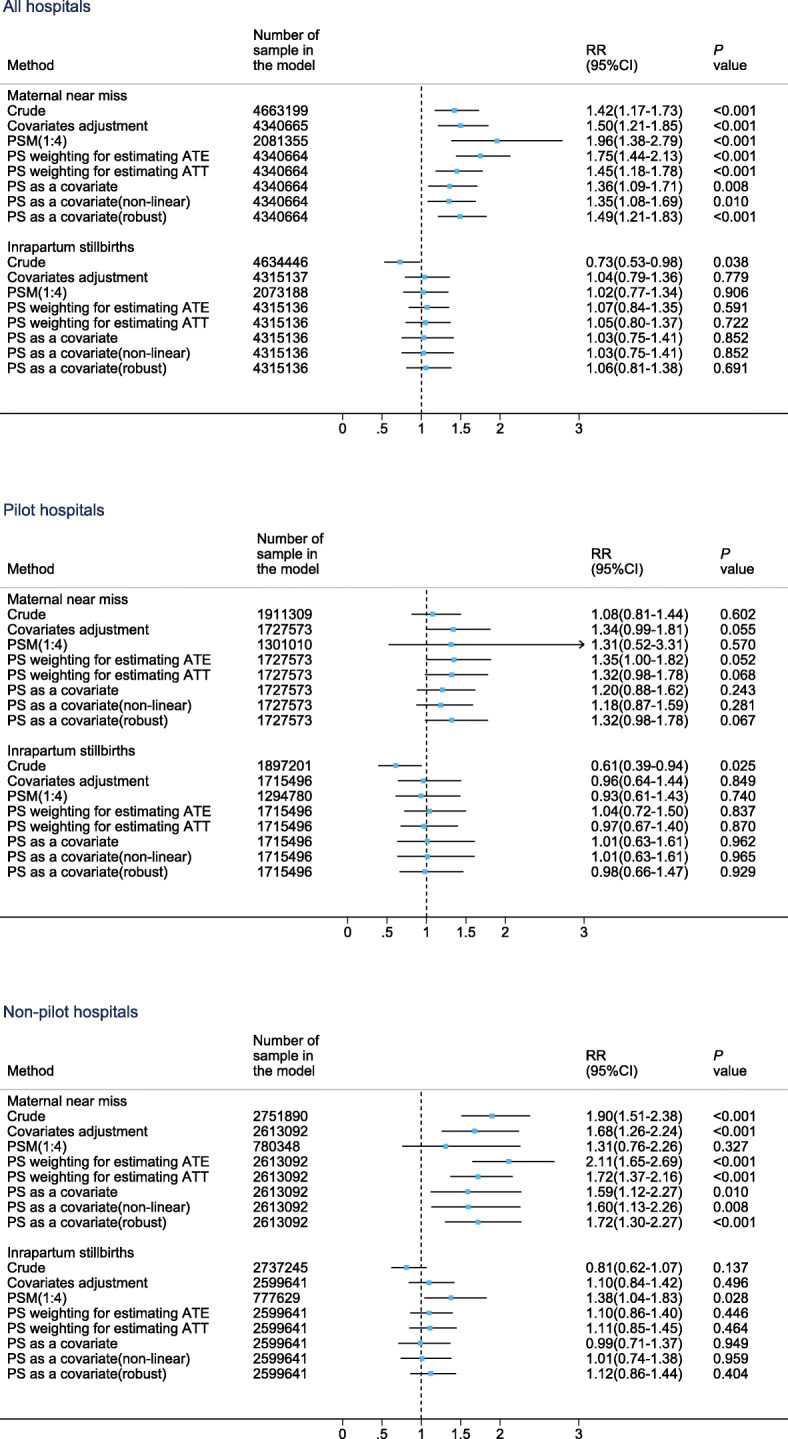
Fig. 3.

Comparison of primary maternal and perinatal outcomes between women with labour neuraxial analgesia and without any analgesia. Notes: PSM propensity score matching, PS propensity score, ATE average treatment effect where weight is 1/PS for a treated case and 1/(1-PS) for a comparison case, ATT average treatment effect for the treated cases where weight is 1 for a treated case and PS/(1-PS) for a comparison case. The left side of the reference line (short dash line in the figure) means lower risk, and the right side means higher risk
